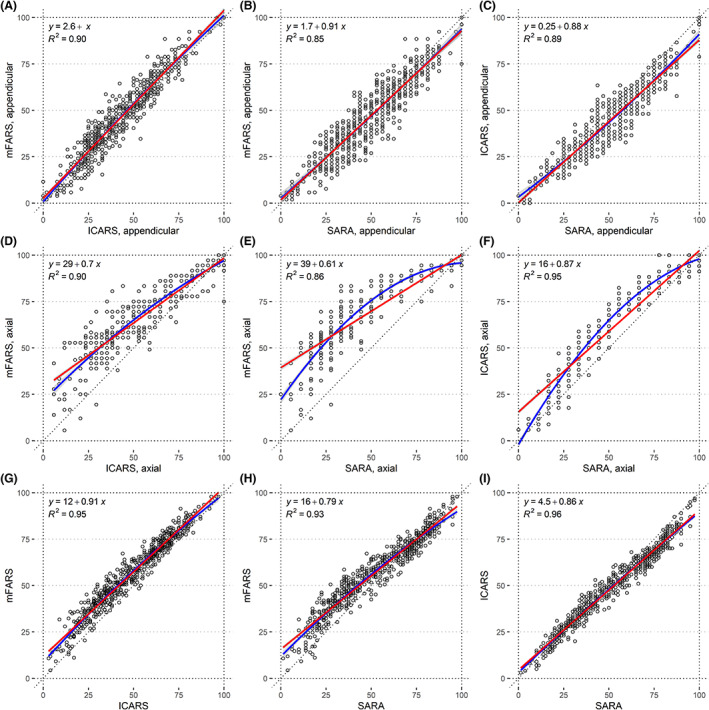
Figure 2.

Correlation plots of percentages of maximum score for the appendicular components of mFARS, SARA, and ICARS (A–C), their axial components (D–F), and the full scores (G–I). Linear correlation is depicted in red, and second‐order polynomial regression is in blue.
