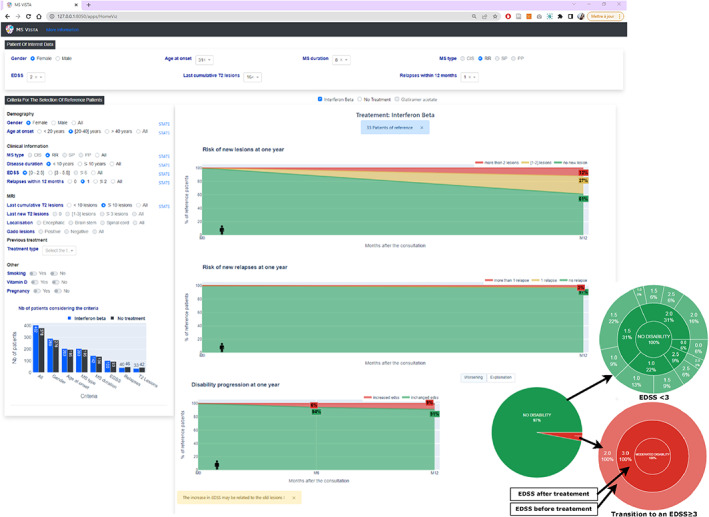
Figure 3.

MS Vista provides temporal visualization of PORs data projections. MS Vista displays interactive graphs demonstrating the probability of worsening at 1 year of the gold standard of therapeutic control indicators of MS activity (new relapses, new MRI lesions, and EDSS) based on PORs data projection. The pie chart provides a dual visualization mode of the EDSS worsening to simplify understanding the outcomes and allow the physician to decide whether the information is sufficient to make a decision. The first view level shows the percentage by which the disability will worsen (the transition from EDSS<3 to an EDSS≥3 24 ) in 1 year. The second view level displays the number of patients corresponding to each EDSS, with more details to provide a more precise visualization.
