
Figure 6.
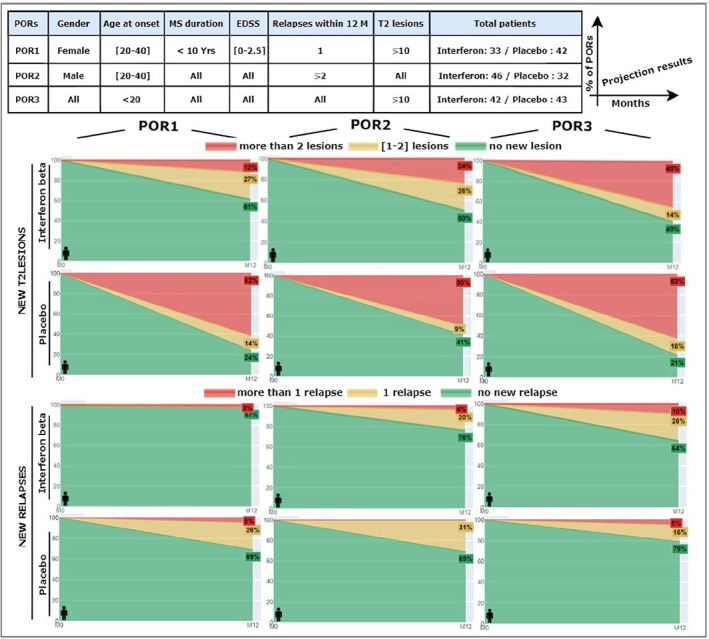
The importance of patient contextualization to illustrate the individual benefits of each treatment option. Three different PORs (table above) were used to illustrate disease activity through percentages of new T2 lesions and new relapses at 1 year of the clinical trial. Differences in the projection results of the three used PORs demonstrate that different factors may contribute to disease progression and also show that the medication efficacy of peginterferon beta‐1a versus placebo may vary depending on patient features.