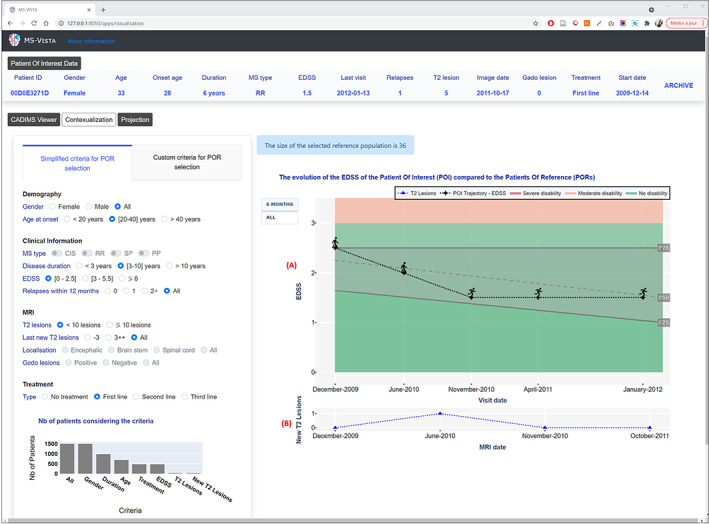
Figure 7.

MS Vista presents the evolution of the EDSS of a POI over time. (A) POI's EDSS trajectory in the context of a PORs percentile distribution over MS duration. The POI is presented by a human icon that changes according to the EDSS value to be more illustrative for patients. Two views are available: the EDSS once every 6 months for clarity and all EDSSs saved for the patient for deeper analysis. (B) Curve of the POI's new T2 lesions at each MRI scan to help physicians decide whether the patient is progressing normally.
