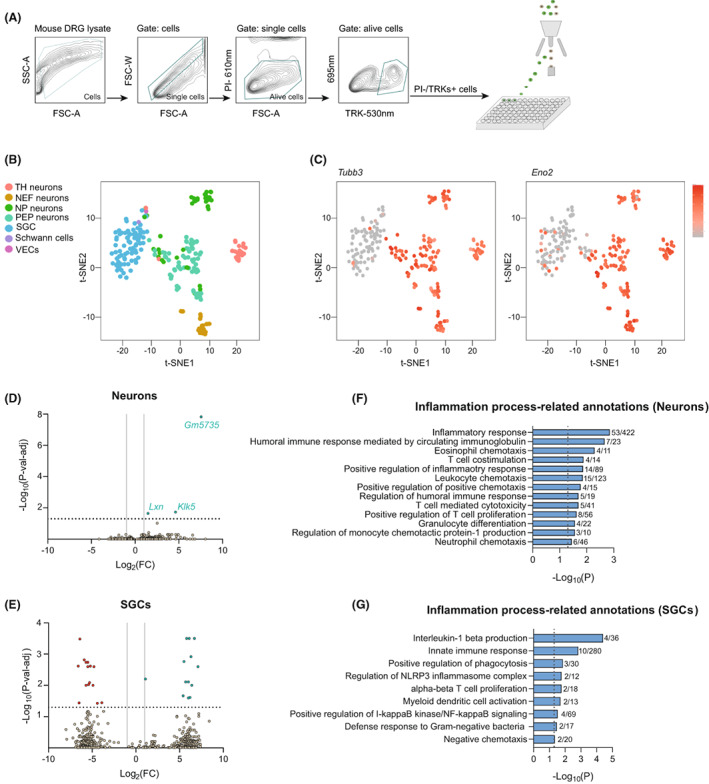
Figure 2.

scRNA‐seq analysis of DRG cell population after oxaliplatin treatment. (A) Single‐cell sorting strategy used to isolate DRG cells. Only cells that were negative for propidium iodide (PI) and positive for TRKs labeling were selected and sorted into the 96‐well plates. All other events were discarded. (B) t‐SNE plot showing the distribution of different cell populations obtained in the analysis. (C) Neuronal populations overexpress the specific neuronal markers Tubb3 (left) and Eno2 (right). Color key represents normalized gene expression with the highest expression marked red and the lowest marked gray. (D, E) Volcano plots of DEGs (p < 0.05) between control and oxaliplatin‐treated mice in sensory neurons (D) and SGCs (E). Each point represents a single DEG. The negative log of p‐val‐adj (base 10) is plotted on the Y‐axis, and the log of the FC (base 2) is plotted on the X‐axis. Only DEGs above the dashed line have a p‐val‐adj <0.05. Green genes are up‐regulated and red genes are down‐regulated in oxaliplatin‐treated mice. Vertical lines indicate Log2(FC) of 1 or −1. Horizontal line indicates the point in which p‐val‐adj <0.05 (−log10(p‐val‐adj) = 1.3). (F, G) Inflammation process‐related GO annotations enriched in neurons (F) and SGCs (G) of oxaliplatin‐treated mice. Vertical lines indicate the point in which p < 0.05. The numbers right of the bars correspond to the “number of genes associated with the given GO term and found in the oxaliplatin vs control comparison”/“number of genes associated with the given GO term in the reference genome”.
