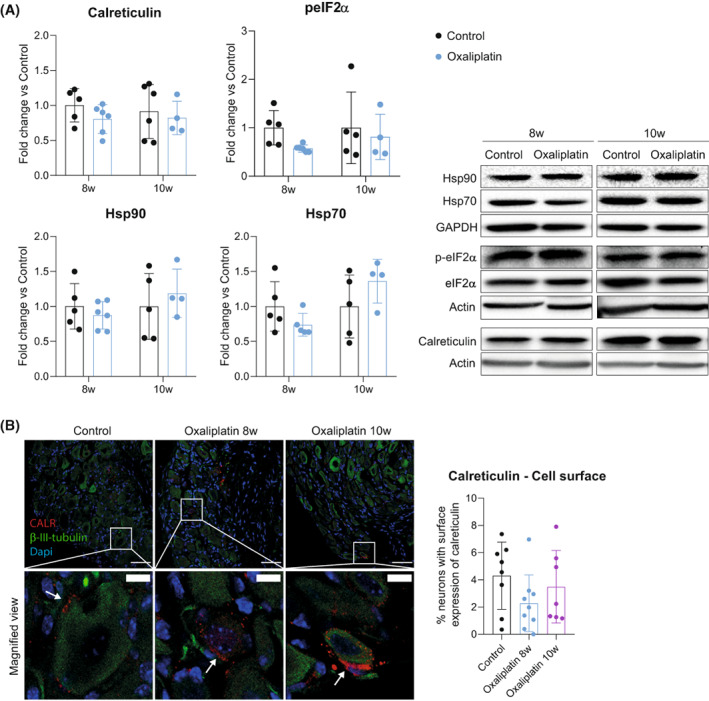
Figure 4.

ICD is not activated in the DRG as a response to oxaliplatin treatment. (A) Left: quantification of the protein levels of ICD hallmarks (calreticulin, peIF2a, Hsp90, and Hsp70) in DRGs of control and oxaliplatin‐treated mice at 8 and 10 weeks. Right: representative western blots of each protein analyzed. n = 4–6 mice/group. Two‐way ANOVA with Bonferroni post hoc test. Data are expressed as fold change vs the average of the control group for each time point (group mean ± SD). (B) Representative images of calreticulin staining (CALR, red) in DRG of control and oxaliplatin‐treated mice at 8 and 10 weeks of the study. β‐III‐tubulin (green) was used to label neurons and nuclei were counterstained with Dapi (blue). White boxes are amplified in the images below (magnified view) for a better visualization of calreticulin staining. White arrows indicate calreticulin staining in the cell surface. Scale bar: 100 μm; Scale bar of magnified views: 20 μm. Graph in the right shows the quantification of the percentage of neurons that express calreticulin in their cell surface. n = 7–9 mice/group. One‐way ANOVA with Bonferroni post hoc test. All data are represented as group mean ± SD.
