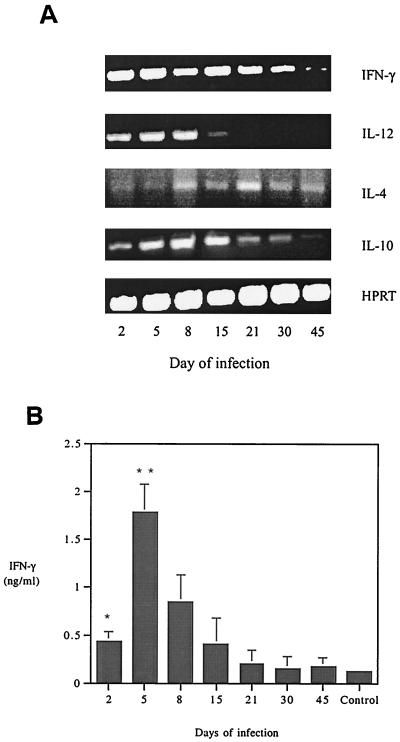
FIG. 3.
(A) Splenic cytokine mRNA levels in C3H mice during infection with aoHGE. cDNA levels of each sample were normalized by using HPRT primers. (B) Serum IFN-γ concentrations measured in sandwich ELISAs. Sera of animals from each time point were pooled and applied to wells as undiluted. Means of triplicate samples are recorded. ∗, P = 0.02 compared to uninfected mice; ∗∗, P = 0.04 compared to day 2 values.

