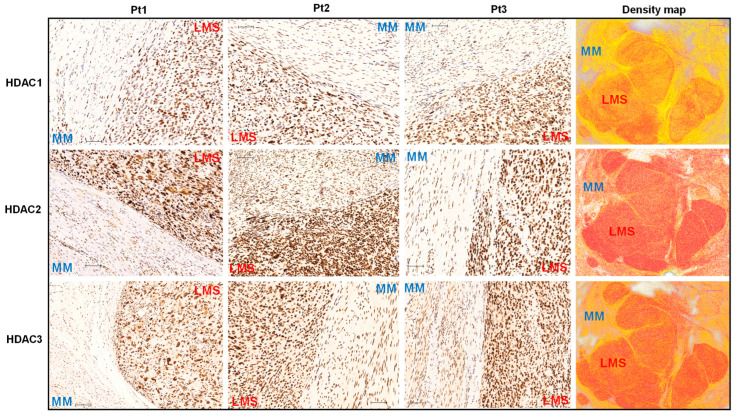
Figure 2.
IHC staining of HDAC1, 2, and 3 in human uLMS tissues and adjacent myometrium. IHC staining for HDAC1, 2, and 3 is presented with three representative cases. The right column showed the density map of HDAC1, 2, and 3 for the same representative case. Blue color: negative; Yellow color: low expression; brown color: moderate expression; red color: strong expression. Scale bars in black color: 100 µm; Scale bars in red color: 1mm.

