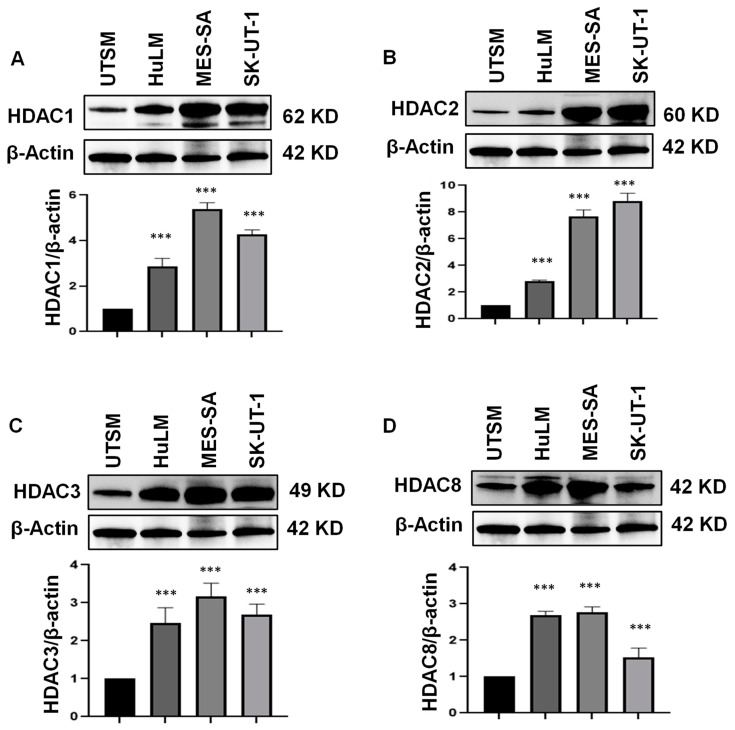
Figure 4.
The expression of Class I HDACs in UTSM, HuLM, MES-SA, and SK-UT-1 cell lines. The protein levels of Class I HDACs (HDAC1 [(A), 2 (B), 3 (C), and 8 (D)] were measured by Western blot. β-actin was used as an endogenous control. Quantitative analysis of relative levels of HDAC1, 2, 3, and 8 (A–D) was performed using Image J (1.53t version) (NIH, Bethesda, MD, USA). *** p < 0.001.

