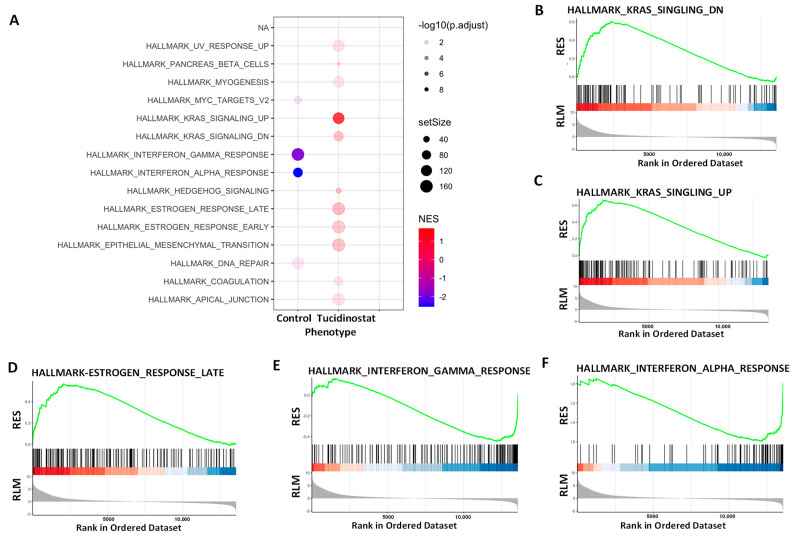
Figure 7.
Hallmark analysis demonstrated the alteration of multiple pathways in SK₋UT₋1 cells in response to Tucidinostat (TD) treatment (Significantly enriched gene sets (HDAC inhibitor vs. control) from GSEA using Hallmark biological processes in MSigDB. (A) Functional pathways analysis identified significantly altered pathways in SK₋UT₋1 cells treated with Tucidinostat. Significantly enriched gene sets (Tucidinostat vs. control) from GSEA using Hallmark biological processes in MSigDB. Gene count and significance levels are shown by the size and color of each circle, respectively. Pathways analysis revealed that several gene sets were altered and associated with KRAS signaling (B,C), estrogen-response (D), interferon-response (E,F). RES: Running Enrichment Score; RLM: Ranked list metric.

