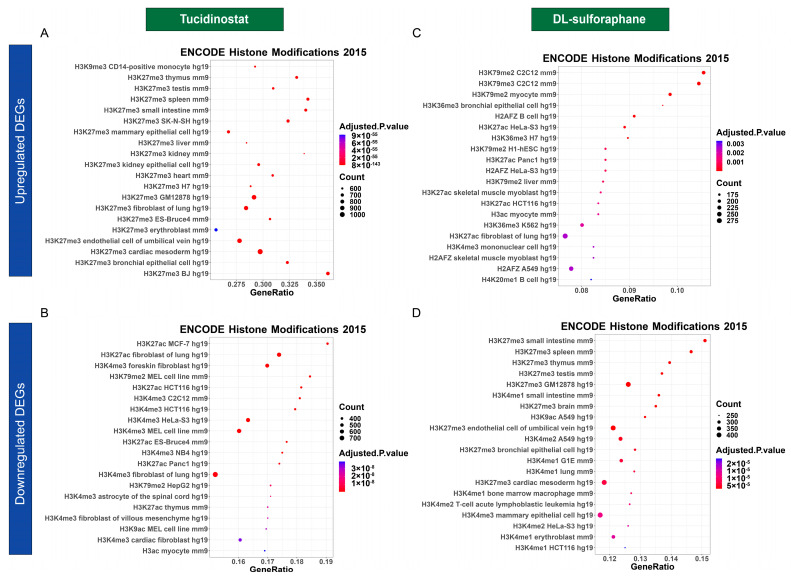
Figure 10.
Dot plot analysis for histone modifications. The dot plots showed the top twenty enrichment terms for histone modification associated with up DEGs (A) and down DEGs (B) in response to Tucidinostat treatment. (C) histone modifications related to up DEGs in response to DL-sulforaphane treatment. (D) histone modifications associated with down DEGs in response to DL-sulforaphane treatment. The X-axis represents the gene ratio, and the y-axis descript the enrichment components. The area of the circle is proportional to the number of genes assigned to the term, and the color accords with the Adjusted p-value.

