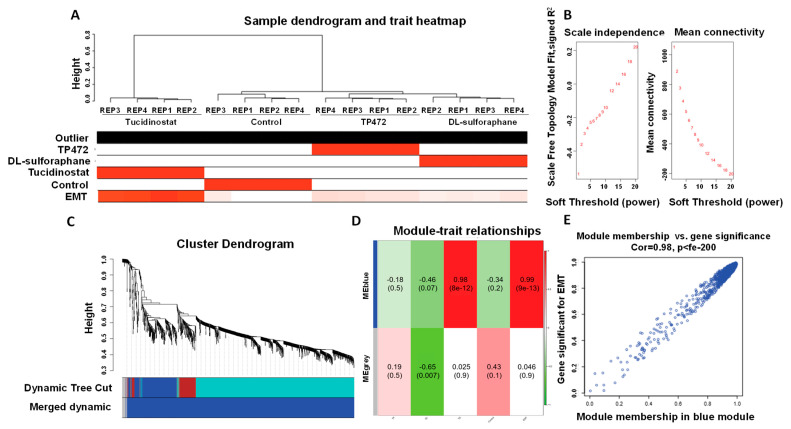
Figure 15.
Sample dendrogram and trait heatmap. (A) The five traits are Tucidinostat, DL−sulforaphane, TP−472, Control, and EMT. (B) Scale independence and mean connectivity of various soft-thresholding values. (C) Gene co-expression network modules. Different colors represent different modules, and gray represents genes that cannot be merged into any module. The bottom colors represent the module after merging modules. (D) Heatmap of the correlation between the clinical traits and MEs. Each cell contains the corresponding correlation and the P value. The table is color-coded by the correlation according to the color legend. (E) Using linear regression, scatter plots of gene significance (GS) vs. module membership (MM) in the blue modules.

