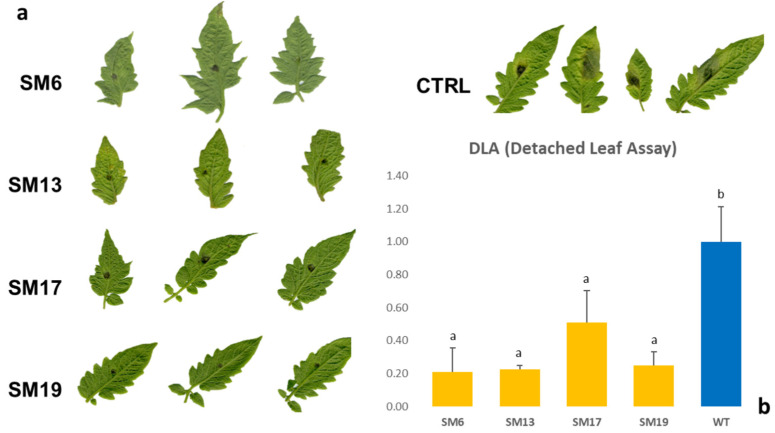
Figure 2.
(a) Detached leaves assay with Phytophthora infestans performed on four pmr4 San Marzano mutants (SM6, 13, 17, and 19) and a wild type plant as a control group at eight days post-inoculation (dpi). (b) In the histogram, normalized LAD% values are reported for each genotype. The y-axis shows the mean ratio of the score of the mutant/control group; bars represent standard deviation (sd). Statistical differences among mutant/control were analyzed with a two-tailed t-test (p < 0.05). Multiple comparisons were performed using two-tailed Student’s t-test with post-hoc Bonferroni’s correction.

