Figure 2.
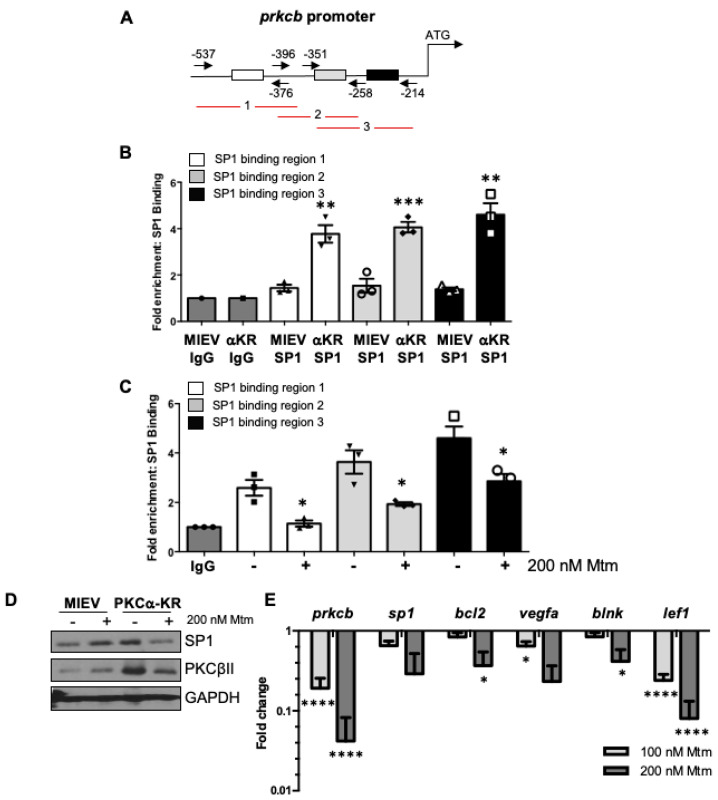
Sp1 binding is upregulated in the prkcb promoter of PKCα-KR transduced CLL-like cells. (A) Diagram showing Sp1 binding sites at the prkcb promoter, the primer locations and the three products; (B) ChIP analysis was performed in MIEV (binding region 1 (black triangles), 2 (white circles), 3 (white triangles)) and PKCα-KR cells (binding region 1 (inverted triangles), 2 (diamonds), 3 (squares)) at the late stage of co-culture (> d17) to determine Sp1 binding occupancy at the prkcb promoter (average of n = 3 biological replicates); (C) ChIP analysis was performed in PKCα-KR cells in the absence (binding region 1 (black squares), 2 (inverted triangles), 3 (white squares)) and presence of 200 nM mithramycin (mtm; binding region 1 (triangles), 2 (diamonds), 3 (circles)) for 12 h to determine Sp1 binding at the prkcb promoter (average of n = 3 biological replicates); (D) The expression levels of Sp1 and PKCβII were determined by Western blotting in MIEV and PKCα-KR cells treated with 200 nM mtm (representative blot shown of n = 3 experiments; densitometry of the blots and the full blots shown in Supplementary Figure S2). (E) qPCR analysis of prkcb, sp1, bcl2, vegfa, blnk, lef1 genes in PKCα-KR cells upon treatment with mtm (average of n = 2/3 biological replicates, an average of technical duplicates). Gapdh was used as the reference gene and normalised to NDC. Unpaired student t-tests (B,C) or one-way ANOVA (E) were used to analyse the data (where biological triplicates were performed). * p < 0.05, ** p < 0.01, *** p < 0.001, **** p < 0.0001.

