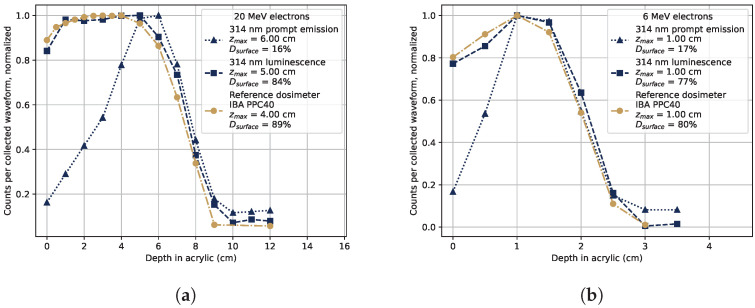
Figure 4.
Generated light intensity in the sample as a function of depth in acrylic at 314 nm. The RIL after the electron pulse (squares) and the prompt light signal (triangles) were separated as in Figure 3. The response of a reference dosimeter, an IBA PPC40, is included in the figures as a gold dash-dotted line. The figure legends display the depth at which the maximal dose was recorded, , and the surface dose (0 cm depth) fraction relative to the maximum dose as . (a) 20 MeV electron beam. (b) 6 MeV electron beam.

