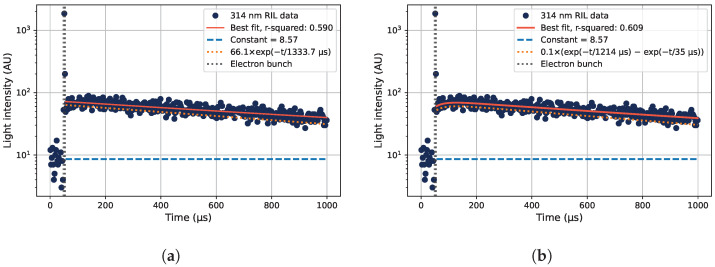
Figure 9.
Measured decay curves of the 314 nm RIL of the Gd3+-doped sample, using 12 MeV electrons at a depth of 2 cm in acrylic. The time of the electron pulse is also shown. (a) Data fitted to one exponential decay component (orange dotted line) plus a constant representing the background level (blue dashed line), according to Equation (2). (b) The data fitted with one exponential decay component with an additional term to account for the initial increase in light emission intensity over time shortly after the electron bunch, described in Equation (3).

