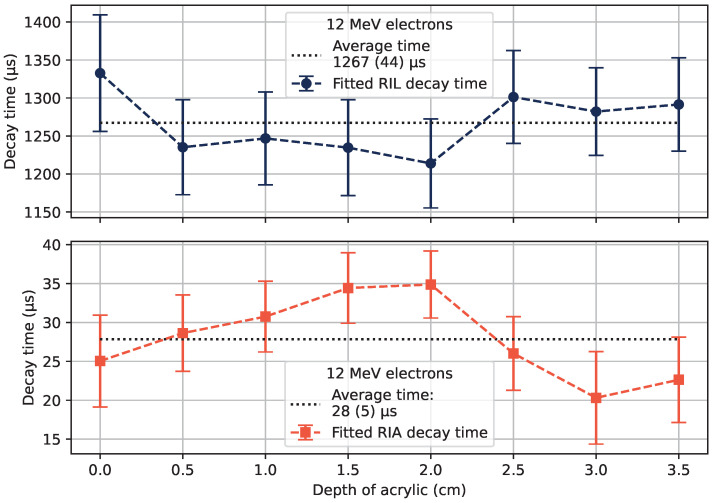
Figure 10.
Fitted luminescence decay times (top), and transient RIA decay (luminescence buildup) times (bottom) at different depths of acrylic for 12 MeV electrons, with the estimated standard deviation of the fitted variable value as the error bars. The average of the measured values is shown with dotted lines, with the estimated standard deviations of the averages in parentheses.

