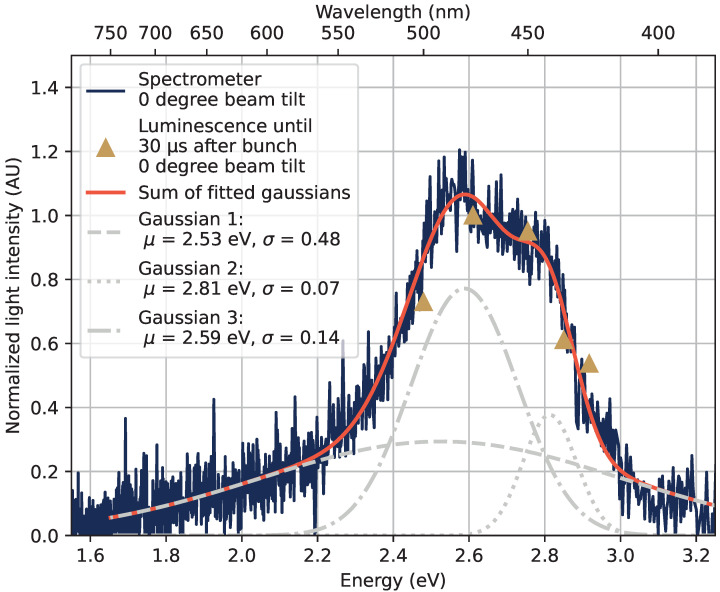
Figure 12.
The observed peak in the optical emission spectrum between 400 nm and 600 nm. The structure is reproduced with an optical spectrometer as the blue line, and by summing the detected photons in the luminescence time region marked in Figure 11 by gold-dashed lines, resulting in the points marked by gold triangles in this figure. The spectrometer measurement was also fitted to a sum of three Gaussian components to recreate the peak shape.

