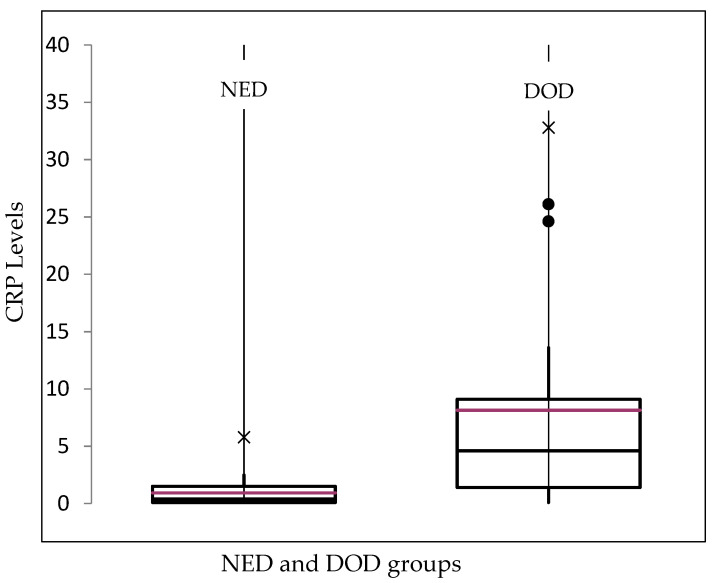
Figure 1.
Box plot of the median CRP values (red line) depending on the follow-up status of the patients: no evidence of disease (NED) and death of disease (DOD). For the alive with disease (AWD) status, no diagram was created because only two patients were involved. ×: extreme outliners, ●: mild outliners.

