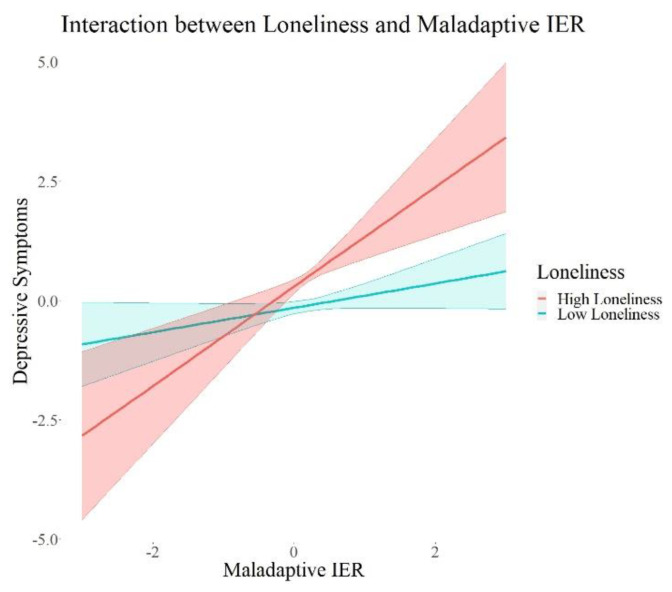
Figure 3.
Interaction Effects between Loneliness and Maladaptive IER on Depressive Symptoms. Note. The shades behind the thicker lines represent the 95% confidence interval. All variables were standardized, and the scales on the graph represent standard deviations (i.e., 2 = 2 units of standard deviation).

