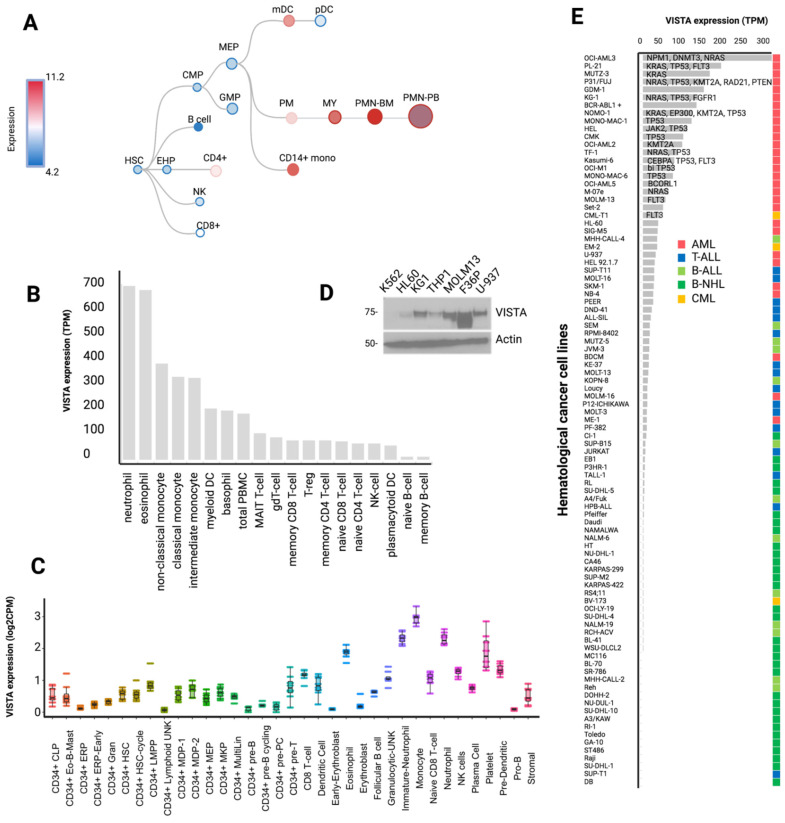
Figure 2.
VISTA transcriptomic profile in normal hematopoiesis and in hematological cancer cell lines. (A) Vista differentiation tree across hematopoietic cell differentiation (data retrieved and adapted from https://servers.binf.ku.dk/bloodspot/, 28 January 2022). (B) Bar plot showing the distribution of VISTA expression values (as transcripts per million, TPM) across several mature peripheral blood cell populations. Raw data were retrieved from https://www.proteinatlas.org/about/download, 21 December 2021. (C) Box plot displaying the distribution of VISTA expression values (TPM) across 35 bone marrow cell types (raw data retrieved from http://www.altanalyze.org/ICGS/HCA/Viewer.php, 13 September 2021). (D) Western blot showing VISTA protein abundance in several hematological cell lines. (E) Bar plot of VISTA expression across hematological cancer cell lines (data retrieved from https://www.ebi.ac.uk/gxa/experiments/E-MTAB-2770/Downloads, 13 September 2021). The text indicates the name of mutated genes in each cell lines. Only representative cell lines are reported.

