Figure 3.
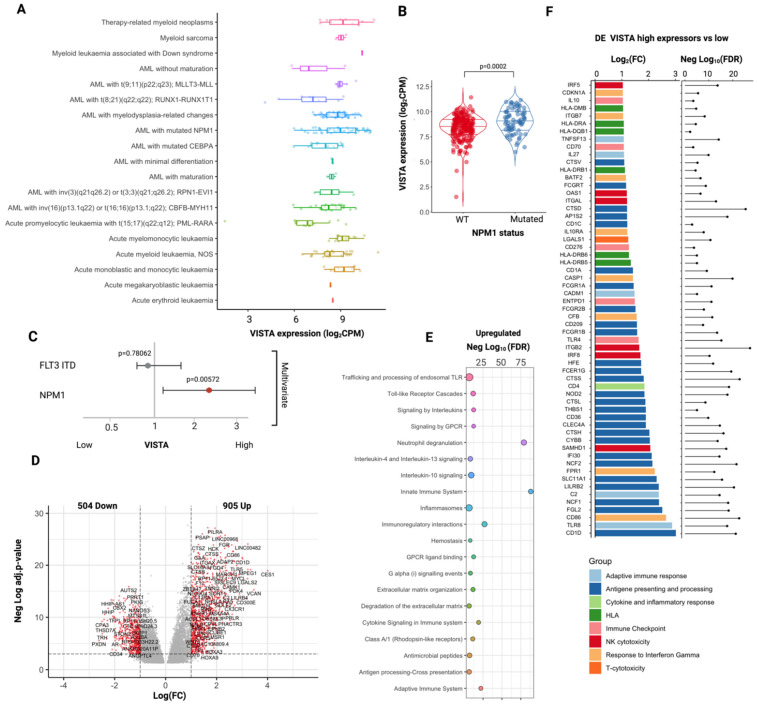
VISTA transcriptomic profile in AML. (A) Boxplots showing the distribution of VISTA expression (logarithmic count per million, logCPM) across several acute myeloid leukemia (AML) subtypes (Beat AML cohort). See Table S8 for pairwise comparisons. (B) Violin plots representing the differences in distribution of VISTA expression values in patients with NPM1-positive vs. NPM1-negative AML (data from bulk RNAseq samples). (C) Multivariate logistic regression model showing the independence of VISTA from FLT3 mutational status in NPM1 cases. Distribution of VISTA expression values according to the different AML FAB subtypes. (D) Volcano plot representing the differential expression analysis of genes up- and down-regulated in VISTA high vs. low expressors. (E) Selected reactome pathways enriched in the gene sets upregulated in VISTA high vs. low expressors (negative log10 of the adjusted p-value—Benjamini–Hochberg correction, gene set enrichment analysis). (F) Selected genes involved in immune responses upregulated in the analysis of VISTA high vs. low expressors (bar plot representing log2 fold change and lollipop plot showing the negative log10 of the adjusted p-value—Benjamini–Hochberg correction).

