Figure 4.
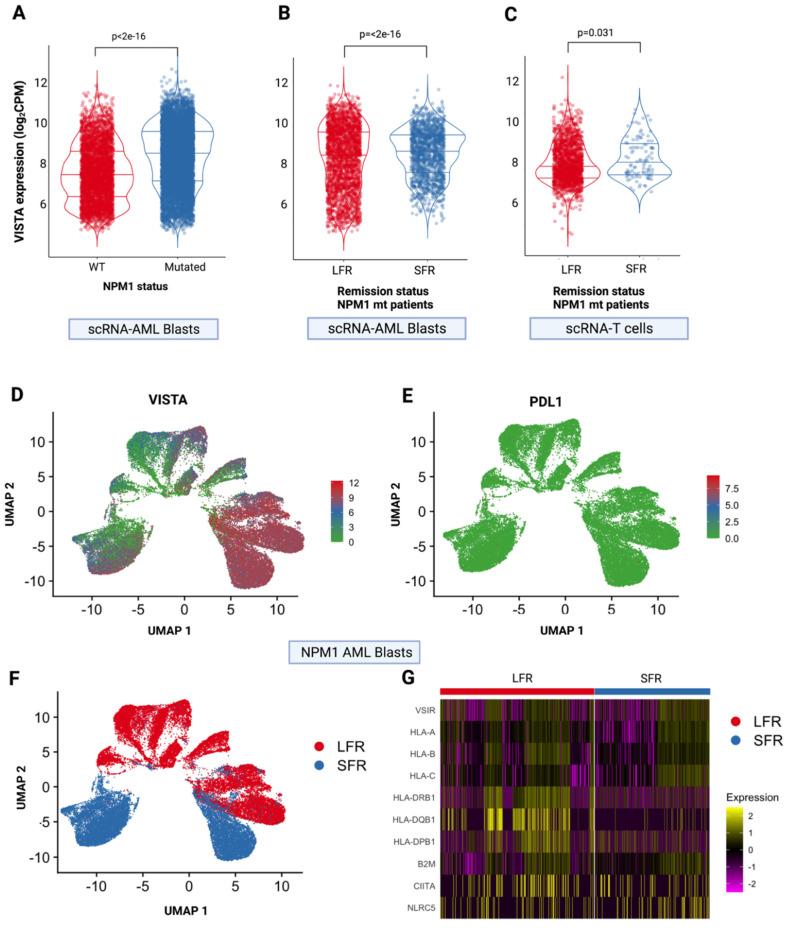
VISTA expression at single cell level. (A) VISTA expression in single-cell RNAseq samples from isolated AML blasts according to NPM1 mutational status. (B) VISTA expression in single-cell RNAseq samples of AML blasts from patients with NPM1 mutations according to the length of first remission (long, LFR, >5 years vs. short, SFR, <2 years). (C) VISTA expression in single-cell RNAseq samples of T cells from patients with NPM1 mutations according to first remission status (long, LFR, >5 years vs. standard, SFR, <2 years). (D) Uniform manifold approximation and projection for dimension reduction (UMAP) of VISTA and (E) PDL-1 expression in AML cells from NPM1-mutated patients (N = 9 single-cell RNAseq samples). Each dot represents a cell; gray dots indicate low or null expression. The purple gradient indicates the intensity of each gene expression (VISTA on the left and PDL1 on the right). (F) UMAP showing the distribution of AML cells in LFS and SFR groups. (G) Heatmap showing the difference in expression of VISTA, HLA genes and HLA class I and II transactivators between LFR and SFR patients.

