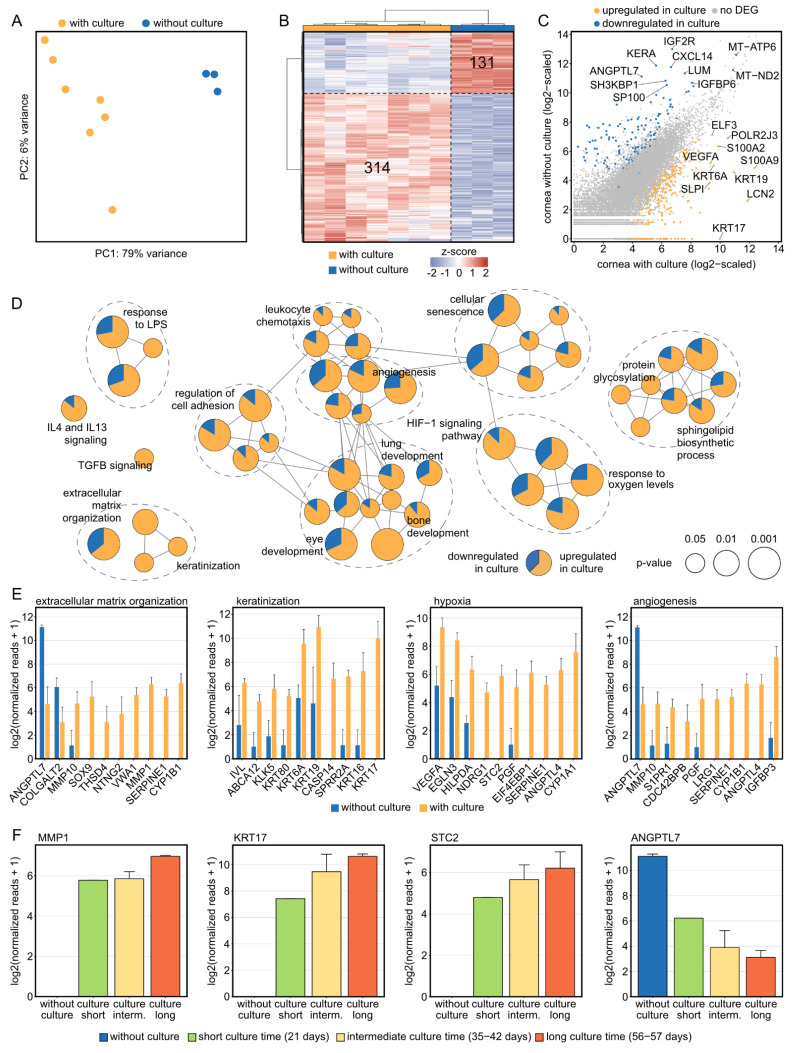
Figure 2.
Corneal tissue culture significantly modulates the transcriptional profile of human corneas. (A) The substantial effect of organ culture is illustrated by unsupervised cluster analysis using principal component analysis. PC: principal component. (B): Heatmap visualizing the 314 significantly up- and 131 significantly downregulated genes by tissue culture. The z-score represents a gene’s expression in relation to its mean expression by standard deviation units (red: upregulation, blue: downregulation). (C): Readplot visualizing differentially expressed genes (DEG) between corneas with and without culture. The top 10 DEG per group are labeled. (D): Functionally grouped network analysis of enriched Gene Ontology biological processes, reactome, KEGG, and Wiki pathways in which the DEG were involved in. Enriched terms are visualized as nodes being linked based on their kappa score, which indicates the similarity of the genes linked to them. The node size represents the term enrichment significance (see legend). Representative terms of each group are labeled. The pie charts visualize the percentage of up- and downregulated genes. (E) The top ten DEG, which were selected based on the absolute value of the log2 fold change, are visualized for each subnetwork from (D). The height of the bar corresponds to mean expression and the error bar represents standard deviation. (F) Changes of expression in dependence of time in organ culture for genes of each subnetwork from (E). Number of samples per group: without culture, 3; short culture time, 1; intermediate culture time, 4; long culture time, 2.

