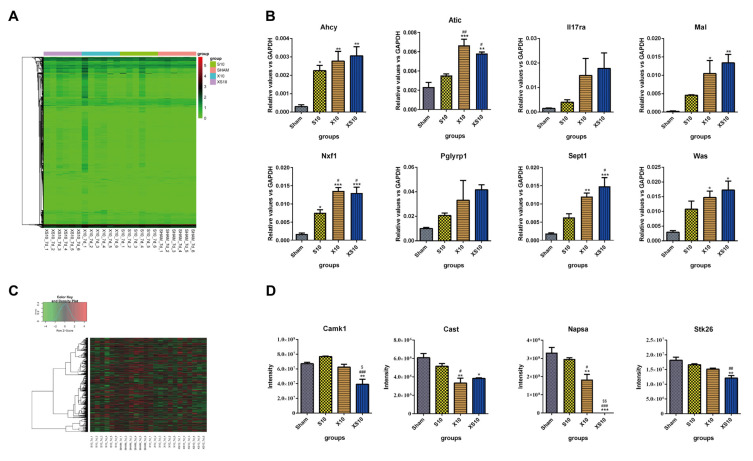
Figure 4.
Transcriptomic and proteomic analysis of peripheral blood at 7 d after multifrequency microwave exposure. At 7 d after microwave exposure, peripheral blood was collected from the Sham, S10, X10 and XS10 groups. (A,B) Transcriptomics analysis. Total RNA was extracted by TRIzol reagent, and RNA sequencing was performed using Illumina NovaSeq. Differential expression analysis between two groups was performed using DESeq2 (v1.20.0) withthe following screening conditions: expression difference multiple |log2FoldChange| > 1, significant q-value ≤ 0.05. Log2-transformed differentially expressed gene data were used for the expression heatmap by the heatmap1.0.10 package (A). The mRNA expression of eight immune activity-associated DEGs was verified by quantitative reverse transcription polymerase chain reaction (qRT-PCR) (B). (C,D) Proteomics analysis. The proteins were extracted from the sera of peripheral blood. After enzymatic degradation and desalination, spectral library was constructed by using a high pH reversed-phase fractionator in data dependent acquisition (DAA) mode. The differentially expressed proteins (DEPs) were analyzed by data independent acquisition (DIA) mode (C). The protein expression levels of four DEPs were verified by mass spectrometry (D). Data are shown as mean±s.e.m.; *, p < 0.05, **, p < 0.01, ***, p < 0.001 vs. Sham group; #, p < 0.05, ##, p < 0.01, ###, p < 0.001 vs. S10 group; $, p < 0.05, $$, p < 0.01 vs. X10 group.

