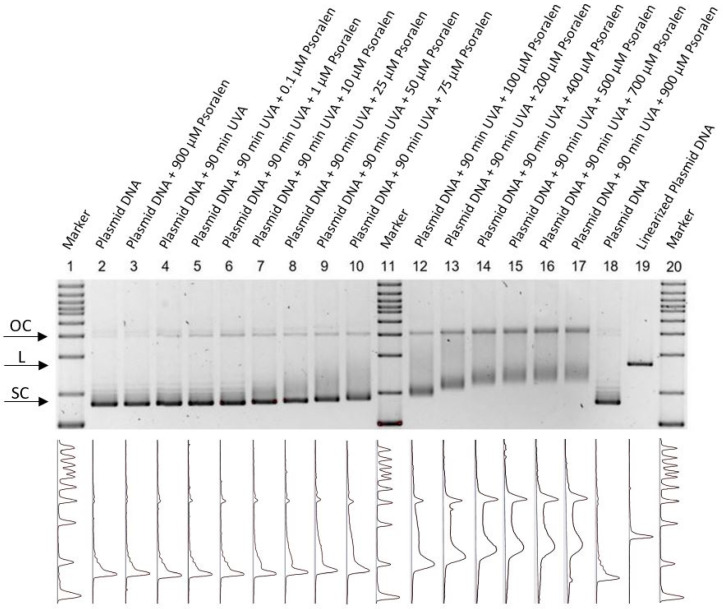
Figure 1.
Fluorescent measurement of an agarose gel for combining psoralen with UV-366 nm. The aperture detects the intensity spectra (bottom) of the fluorescent gels and displays them visually (top). The figure is inverted, thus showing a dark color for high intensities. Since this measurement is not quantitative, the intensity scale only shows arbitrary units. Markers are placed in lanes 1, 11, and 20. Lane 2 and 18 show untreated plasmid DNA, whilst lane 19 contains enzymatically linearized plasmid as the control. In lanes 4–10 and 12–17, different psoralen concentrations (0, 0.1, 1, 10, 25, 50, 75, 100, 200, 400, 500, 700, 900 µM) were irradiated with UV-366 nm for 90 min. Each lane was normalized and shows the running behavior of the different setups. A higher concentration of psoralen showed a higher amount of open circular conformations (OCs). Lane 3 demonstrates non-UV-activated psoralen (900 µM).

