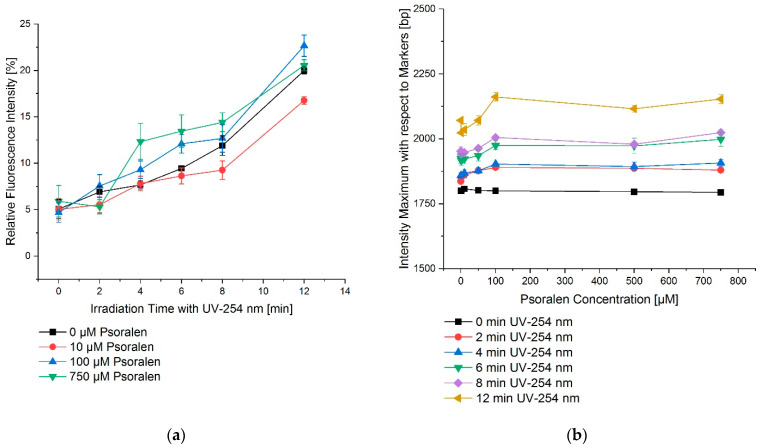
Figure 3.
UV irradiation time–effect relations for the combination of psoralen with UV-254 nm. (a) OC fraction as a function of irradiation time, (b) OC fraction as a function of psoralen concentration. The effects are displayed as changes in the migration distances of DNA in relation to the markers bp. To increase the irradiation time, the effect as in relative fluorescence intensity also increased. However, this effect was nearly concentration independent. The error bars show the SEM.

