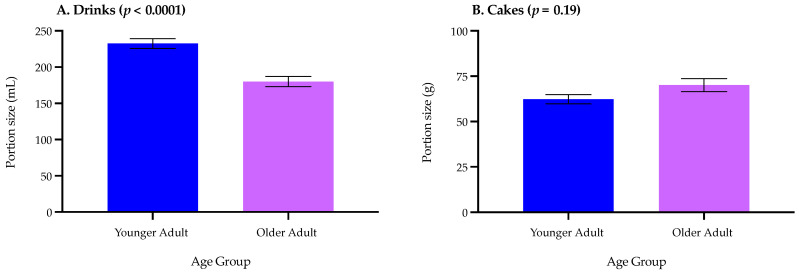
Figure 3.
Consumers’ (n = 73) ideal portion size relating to (A) drinks and (B) cakes by age (younger adults n = 41 and older adults n = 32). Data reflected all drink and cake types presented (as defined in Table 1) and expressed as means ± standard error.

