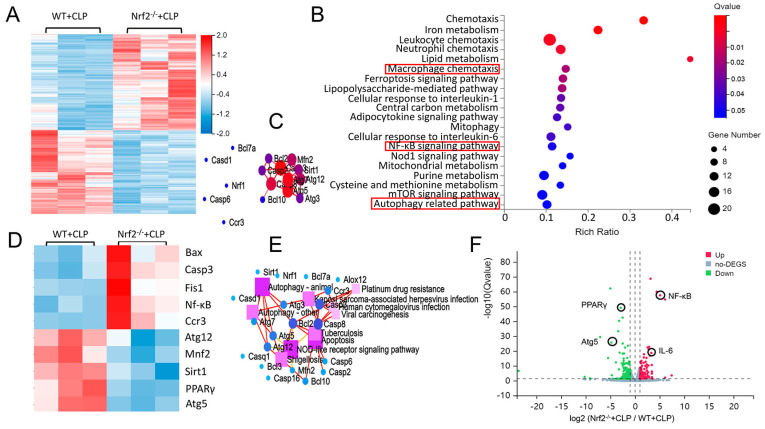
Figure 3.
Transcriptome sequencing analyses of lung tissues in CLP-treated WT and Nrf2−/− mice. (A) Hierarchical clustered heatmap of DEGs in lung tissues of CLP-treated WT mice (WT+CLP) and CLP-treated Nrf2−/− mice (Nrf2−/− + CLP); n = 6 mice per group. (B) KEGG enrichment analysis identified the most significantly altered signaling pathways after Nrf2 deletion; n = 3 in each group. (C) Construction of Nrf2-related PPI regulatory network based on DEGs. (D) Heatmap of DEGs in CLP-treated WT and Nrf2−/− mice. (E) Network of KEGG pathway based on the similarity of gene expression profiles. (F) Volcano plot showing DEGs of CLP-treated WT and Nrf2−/− mice. The red markers represent genes that were significantly upregulated, and the green markers represent genes that were significantly downregulated, while insignificantly altered genes are highlighted in gray; log2 fold change > 1, Q value < 0.05.

