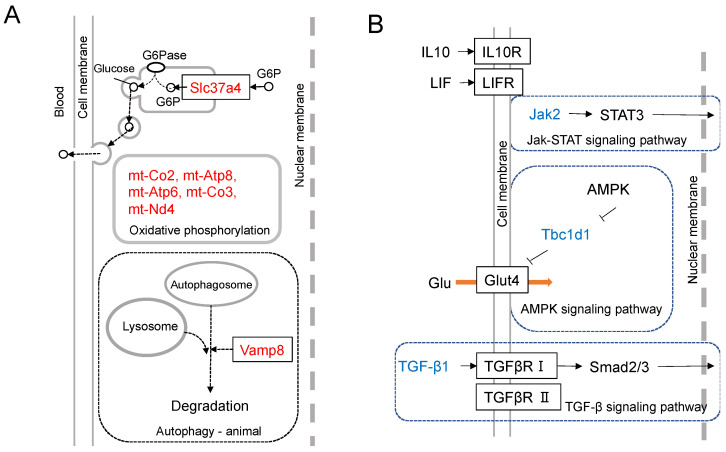
Figure 3.
Results of transcriptome analysis. (A) Differential expression of Nanog-dependent genes between Nanog+BL6 and B16-BL6 cell lines. Assumed-role diagrams of up-regulated top-7 genes (Slc37a4, mt-Atp6, mt-Nd3, mt-Co3, mt-Atp8, mt-Co2, and Vamp8). (B) Differential expression of Nanog-dependent genes between Nanog+BL6 and B16-BL6 cell lines. Assumed-role diagrams of down-regulated top-3 genes (Jak2, Tbc1d1, and TGF-β1).

