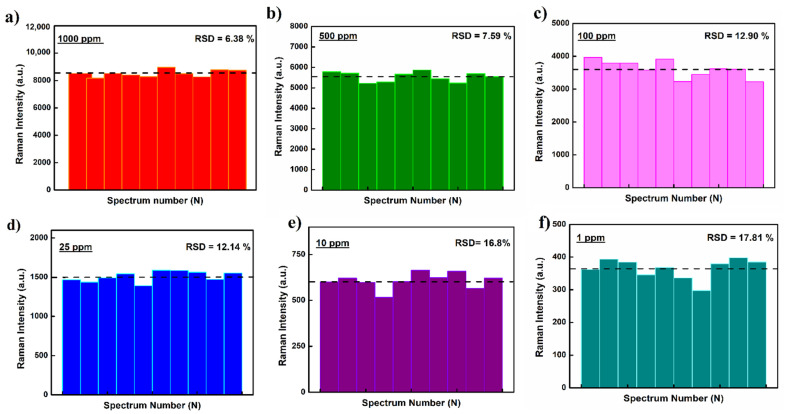
Figure 3.
(a−f) SERS intensity variability for tested DA concentrations collected at random locii on the fabricated AgNps-DE substrates. RSD = relative standard deviation of the SERS signal. The dotted black line represents the average intensity value for peak reflection at 1609 cm−1 for respective tested concentration.

