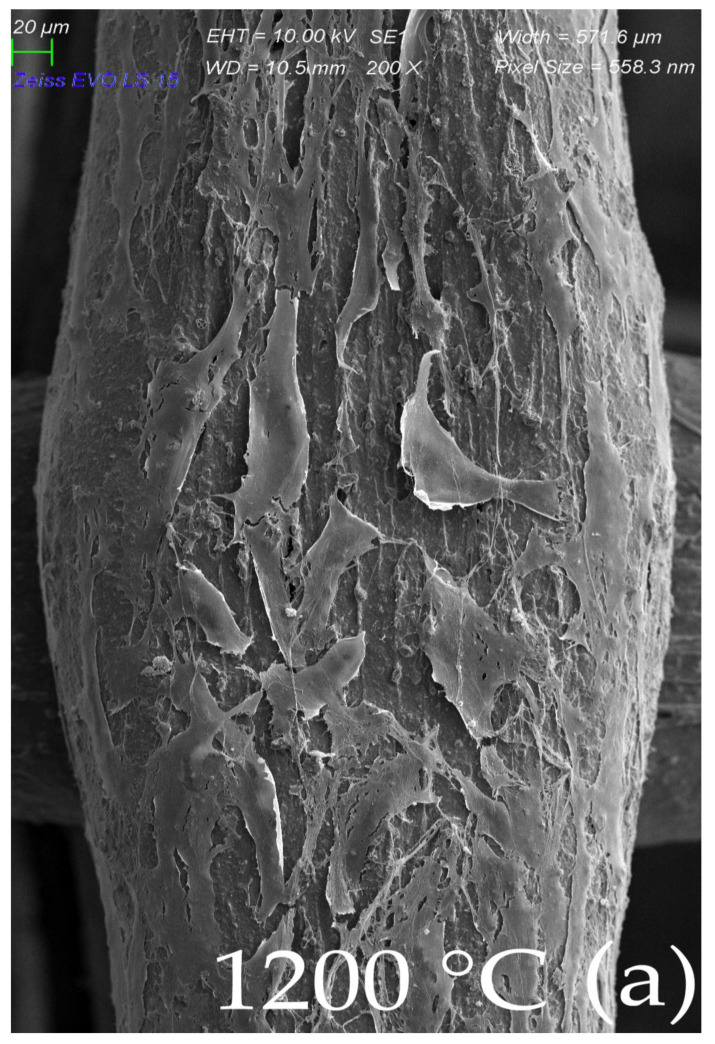
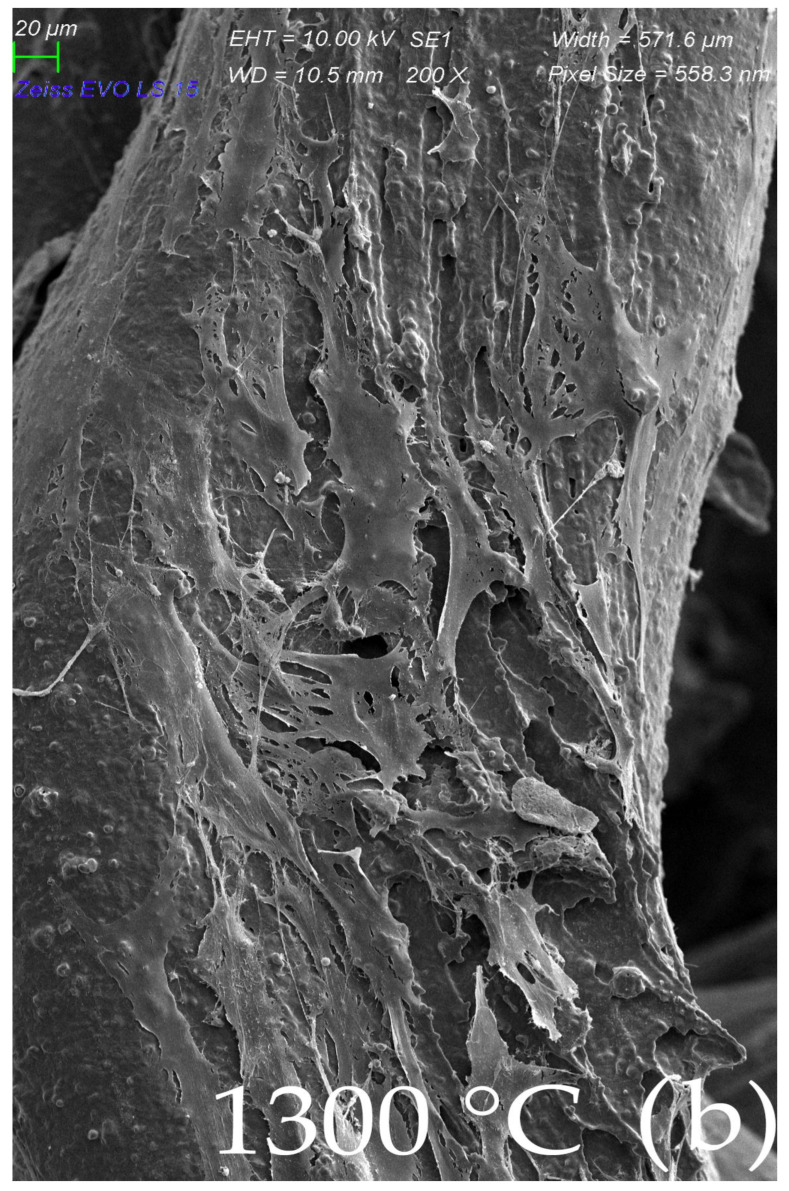
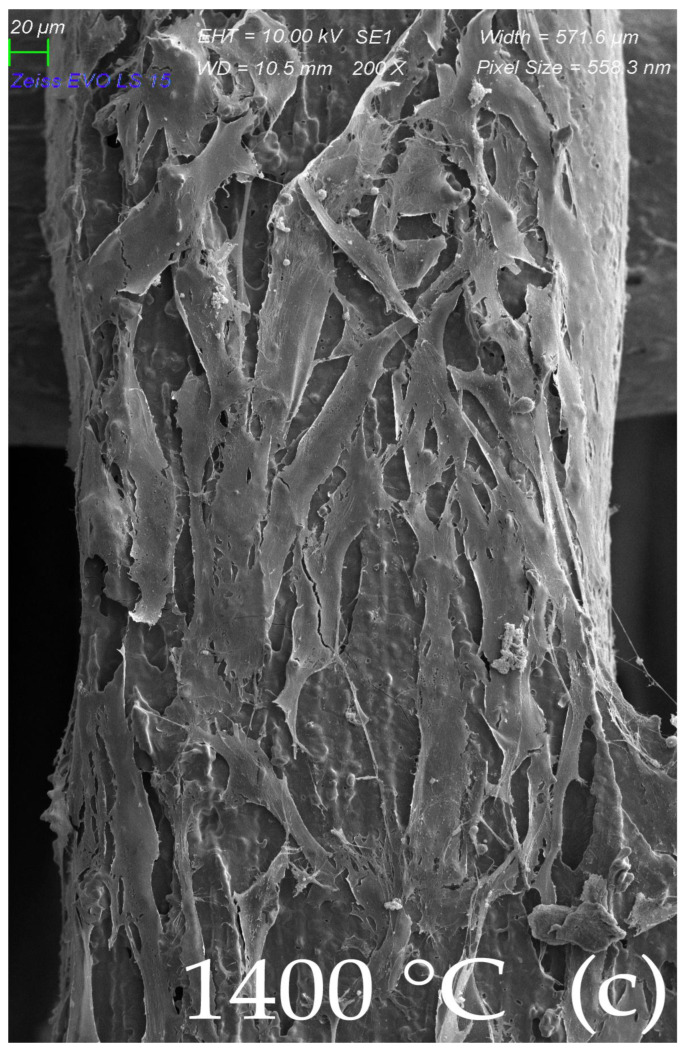
Figure 8.
Morphological SEM evaluation of biocolonization evaluated gyroid scaffolds sintered in three different temperatures (1200, 1300, and 1400 °C): (a) Surface of MSCs culture, cultivated on scaffold sintered at 1200 °C. SEM, Mag ×200. Flat cells are sparsely distributed throughout a scaffold line surface. Long elongated projections connect to the line surface and to each other; (b) Surface of MSCs culture, cultivated on scaffold sintered at 1300 °C. SEM, Mag ×200. Similar patterns of cell distribution projections overlap more frequently; (c) Surface of MSCs culture, cultivated on scaffold sintered at 1400 °C. SEM, Mag ×200. A monolayer of flat cells with intensive cell overlapping and few of them with vesicles probably due to most beneficial conditions.


