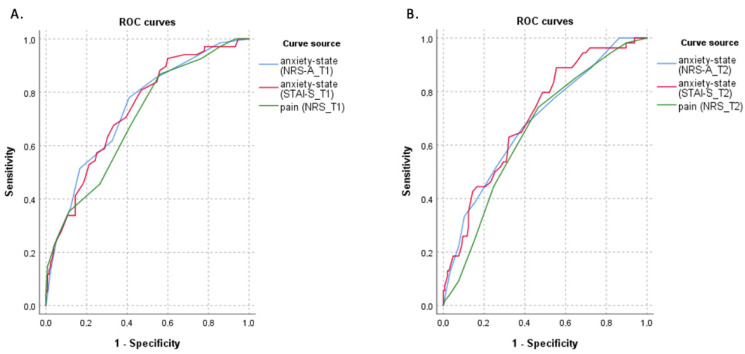
Figure 1.
1. ROC curves. (A). Calculated for NRS_T1 (AUC = 0.699; p < 0.001), for NRS-A_T1 (AUC = 0.737; p < 0.001) and for STAI-S_T1 (AUC = 0.709; p < 0.001) using NEN_T1 where a score greater than 3 was selected as an indicator of the presence of NEN on T1. The NRS cut-off value of 3.5/10 reflected the best combination of sensitivity (87%) and specificity (44%). The NRS-A cut-off value of 3.5/10 reflected the best combination of sensitivity (78%) and specificity (59%). The STAI-S cut-off value of 42.5/80 reflected the best combination of sensitivity (68%) and specificity (67%). (B). Calculated for NRS_T2 (AUC = 0.654; p < 0.001), for NRS-A_T2 (AUC = 0.689; p < 0.001) and for STAI-S_T2 (AUC = 0.709; p < 0.001) using NEN_T2 where a score greater than 3 was selected as an indicator of the presence of NEN on T2. The NRS cut-off value of 3.5/10 reflected the best combination of sensitivity (74%) and specificity (53%). The NRS-A cut-off value of 3.5/10 reflected the best combination of sensitivity (67%) and specificity (61%). The STAI-S cut-off value of 37.5/80 reflected the best combination of sensitivity (89%) and specificity (44%).

