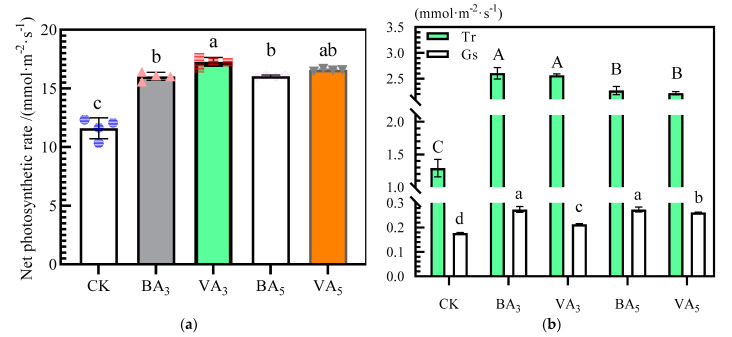
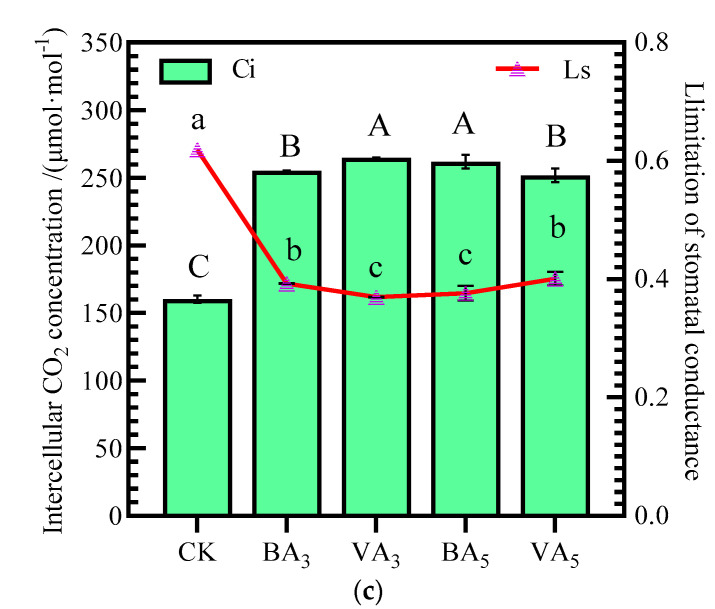
Figure 2.
Effects of BA and VA rates on photosynthetic parameters of tomato leaves: (a) Effects of BA and VA rates on the Pn. (b) Effects of BA and VA rates on the Tr and Gs. (c) Effects of BA and VA rates on the Ci and Ls. Note: BA represents biochar application and VA vermicompost application. The meanings of the circles, triangles, and rectangles on the bars in (a) are indicated as duplicate data points for the different treatments. Means of Pn, Gs, and Ls are significantly different between BA and VA rates (p ≤ 0.05) when followed by different lowercase letters. Means of Tr and Ci are significantly different between BA and VA rates (p ≤ 0.05) when followed by different uppercase letters.Meanwhile, the increase in Pn in BA3, VA3, BA5, and VA5 was accompanied by a decrease in Ls and an increase in Ci, Tr, and Gs. As shown in (b), the highest and lowest Tr rates were observed for BA3 and CK treatments, respectively, and BA3 and VA3 showed no statistically significant difference. Gs under BA3 treatment was the highest, whereas that under CK treatment was the lowest. For Ci (c), the highest Ci was observed for treatments under VA3, followed by plants under BA5, BA3, and VA5, whereas the lowest values were observed under CK. Ls under BA3, VA3, BA5, and VA5 treatments decreased by 37%, 40%, 39%, and 35%, respectively, compared with that under CK treatment.


