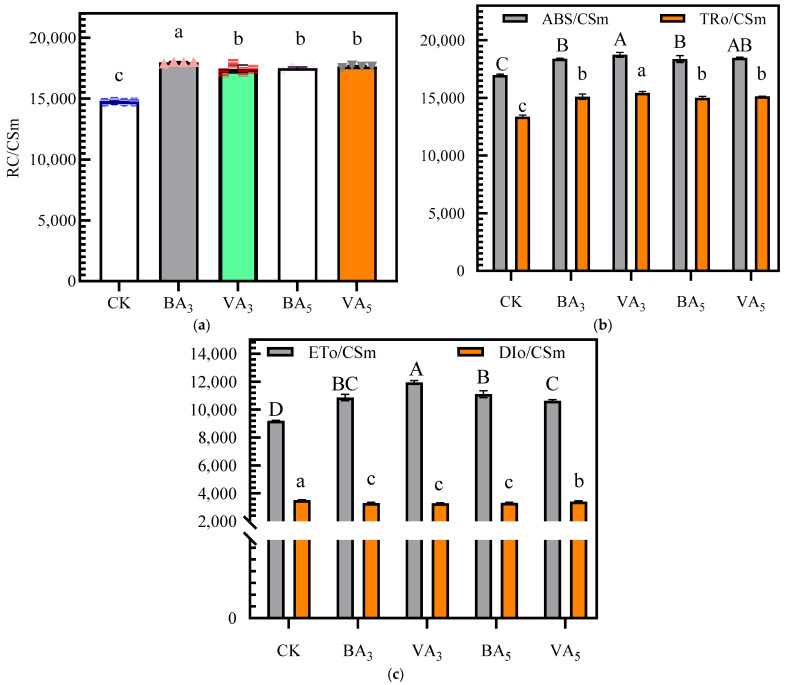
Figure 3.
Effect of BA and VA rates on light energy absorption, capture, and transfer: (a) Effect of BA and VA rates on the RC/CSm. (b) Effect of BA and VA rates on the ABC/CSm and TRo/CSm. (c) Effect of BA and VA rates on the ETo/CSm and DIo/CSm. Note: BA represents biochar application and VA vermicompost application. Data are presented as mean ± standard error (n = 4). The meanings of the circles, triangles, and rectangles on the bars in (a) are indicated as duplicate data points for the different treatments. Means of RC/CSm, TRo/CSm, and DIo/CSm are significantly different between BA and VA rates (p ≤ 0.05) when followed by different lowercase letters. Means of ABC/CSm and ETo/CSm are significantly different between BA and VA rates (p ≤ 0.05) when followed by different uppercase letters. RC/CSm indicates the number of active reaction centers per CS; ABS/CSm indicates the absorption flux per CS; TRo/CSm indicates the trapped energy flux per CS; ETo/CSm indicates the electron transport flux per CS; DIo/CSm indicates the non-photochemical quenching per CS.

