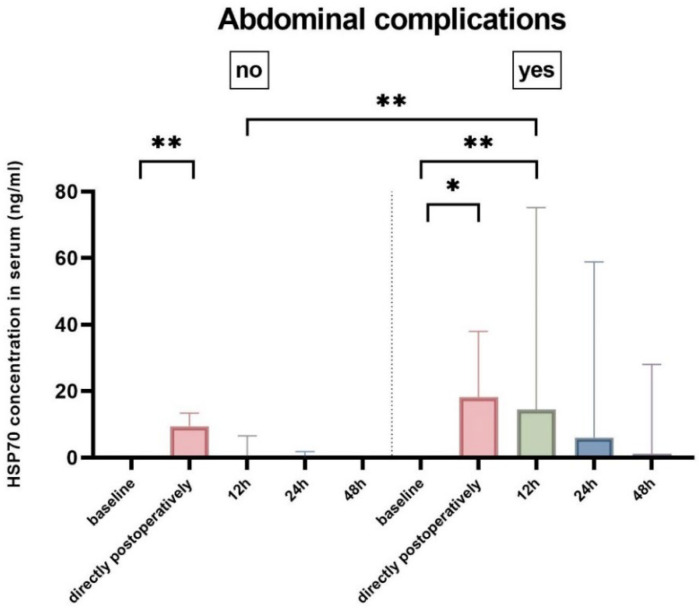
Figure 2.
Heat-shock protein 70 (HSP70) serum levels at different time points for the two groups: abdominal complications (n = 9) and no abdominal complications (n = 12). Bar represents the median, and the whiskers represent the interquartile range. Significance is annotated above the brackets as (*) for p < 0.05 and (**) for p < 0.01.

