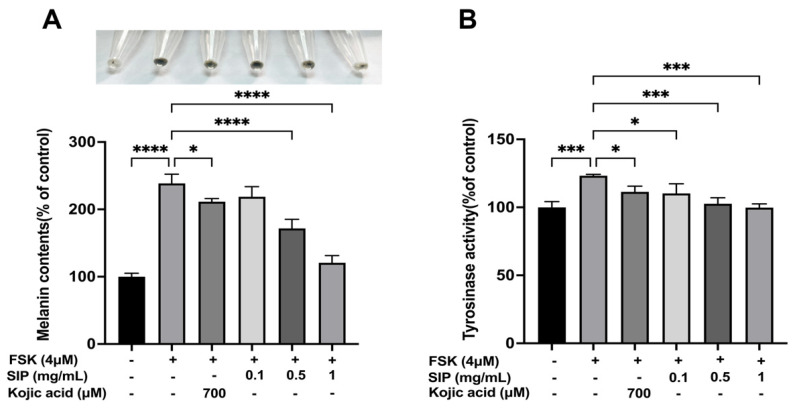
Figure 4.
Effects of SIP on the melanin content and tyrosinase activity in FSK-stimulated B16F10 melanoma cells. (A) Melanin concentration following SIP treatment for 72 h with the indicated concentration. (B) Tyrosinase activity following SIP treatment for 24 h with indicated concentration. Results were presented as the mean ± SD. Statistical analysis was performed with one-way ANOVA, followed by Tukey’s multiple comparison test (n = 3; * p < 0.05, *** p < 0.001, and **** p < 0.0001 compared with the forskolin-stimulated group).

