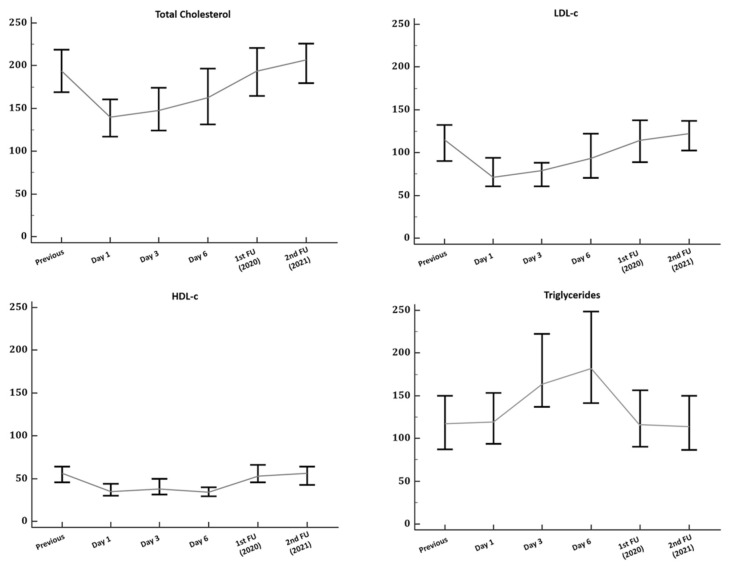
Figure 1.
Temporal changes in lipid profiles in patients with a definitive diagnosis of COVID-19. Data in graphs are presented as median and the interquartile range with error bars representing 95% confidence intervals. Control patients were not included in this analysis. Abbreviations: FU—follow-up; HDL-c—high-density lipoprotein cholesterol; LDL-c—low-density lipoprotein cholesterol; TC—total cholesterol.

