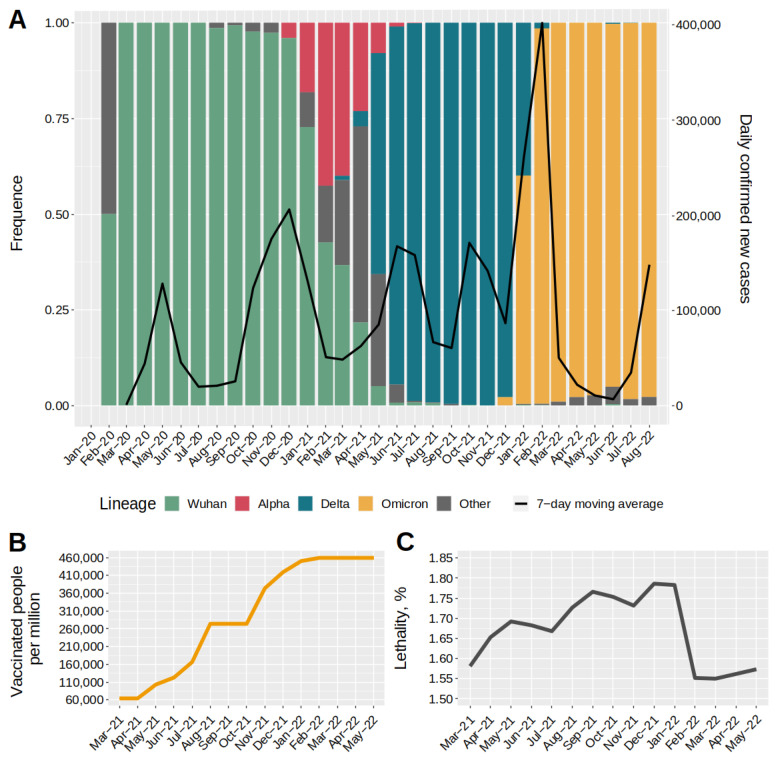
Figure 2.
Dynamics of major SARS-CoV-2 genetic lineages in Moscow, COVID-19 incidence, and number of vaccinated individuals. (A) Profile of changes in major genetic lineages since viral outbreak in Moscow. The second ordinate scale shows the number of new cases. The black line shows the dynamics of new cases. (B) Cumulative value of fully vaccinated patients during mass vaccination in 2021–2022. The ordinate axis shows the number of fully vaccinated people per 1 million inhabitants. (C) Value of lethality in 2021–2022. Lethality is expressed as a percentage and was calculated as the ratio of patients who died to those who became ill.

