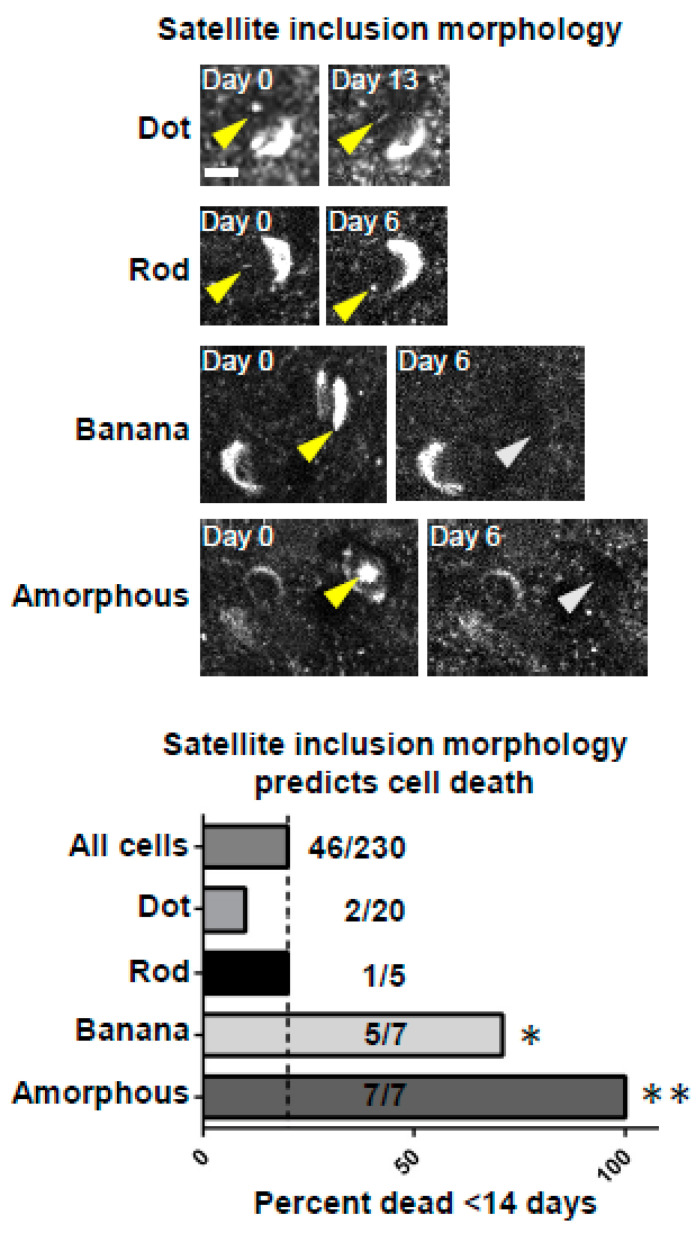
Figure 5.
Development of specific intranuclear aggregate morphologies predicts imminent cell death. Top: Examples of specific intranuclear aggregate morphologies (dot, rod, banana, and amorphous). Scale bar: 5 μm. Bottom: Group data showing predictive value for the development of intranuclear inclusions with different morphologies in predicting cell death within the next 14 days compared to the frequency expected from “all cells”, which includes those with and without intranuclear inclusions (dotted line). The first value to the right of each column represents the number of cells that died within 14 days in that category, and the second number represents the total number of cells detected in that category. The probability of observing this number of cell death events by chance using the binomial distribution predicted p-values * < 0.005 for “banana” and ** <0.0001 for “amorphous” inclusions.

