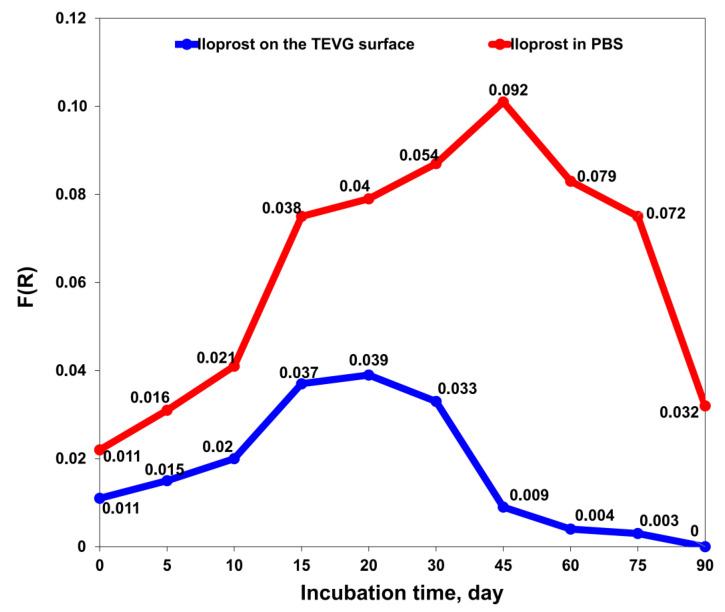
Figure 3.
Release kinetics of iloprost from PCLIlo/CAD TEVGs over 90 days measured by Fourier-transform infrared spectroscopy. The graph represents iloprost content on the TEVG luminal surface (blue line and dots) and in phosphate-buffered saline (red line and dots) at ascending time points of incubation (1, 5, 10, 15, 20, 30, 45, 60, 75 and 90 days).

