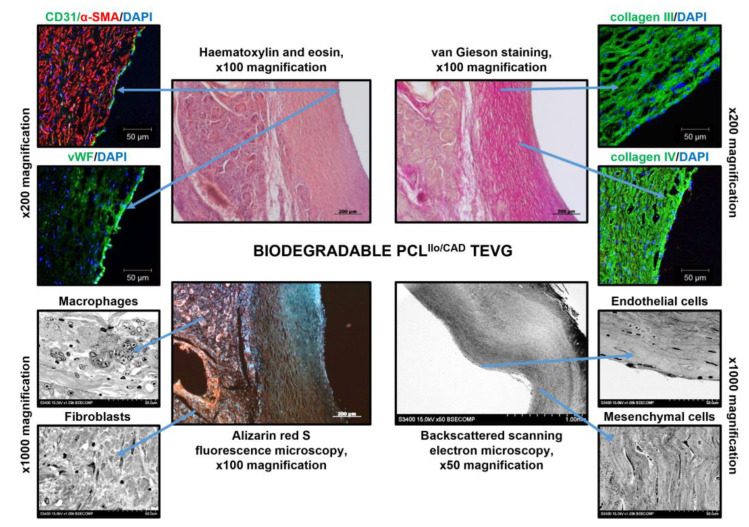
Figure 8.
Microscopic examination of the TEVG implanted into the ovine carotid artery for 6 months. Centre: haematoxylin and eosin staining, van Gieson staining, and alizarin red S staining, ×100 magnification, scale bar: 200 µm (for EM-BSEM analysis: ×50 magnification, scale bar: 1000 µm). Left top: immunofluorescence staining for ECs (CD31 or vWF) and VSMCs (α-SMA), ×400 magnification, scale bar: 50 µm. Right top: immunofluorescence staining for medial collagens (type III and type IV), ×400 magnification, scale bar: 50 µm. Nuclei are counterstained with DAPI. Left bottom: EM-BSEM analysis, macrophages and fibroblasts, ×1000 magnification, scale bar: 50 µm. Right bottom: ECs and mesenchymal cells, ×1000 magnification, scale bar: 50 µm.

