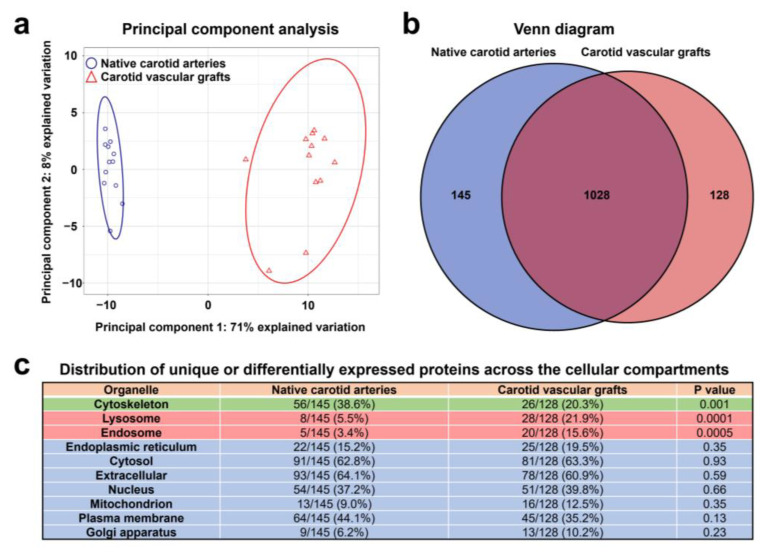
Figure 9.
Shotgun proteomics analysis of TEVGs and contralateral carotid arteries by UHPLC-MS/MS. (a) Principal component analysis demonstrates clear discrimination of native carotid arteries (blue circles) and TEVGs (red triangles) implanted into the ovine carotid artery for 6 months, each point represents one sample. (b) Venn diagram showing the number of proteins unique or significantly overexpressed in the native carotid arteries (145) and TEVGs (128). (c) Distribution of differentially expressed proteins across the cellular compartments (annotated according to the COMPARTMENTS database); note the overrepresentation of cytoskeleton proteins in the native carotid arteries and abundance of lysosomal and endosomal proteins in the TEVGs.

