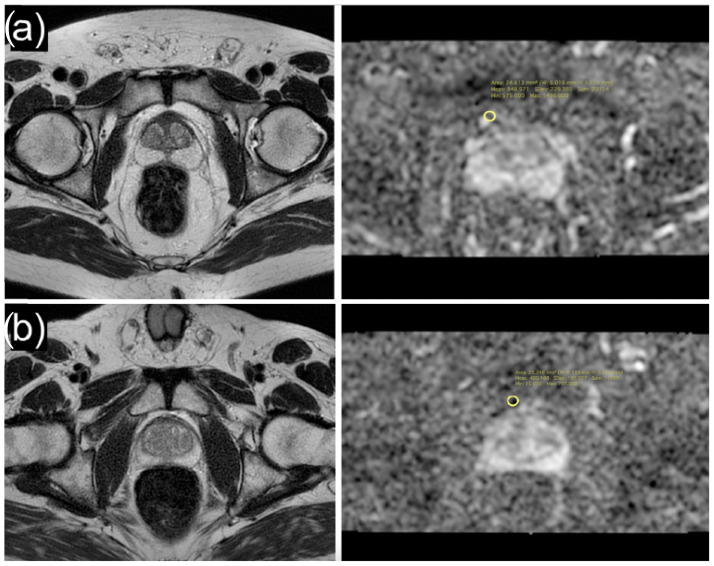
Figure 1.
Axial T2-weighted image and ADC map of a 71-year-old patient with high ADC values (mean: 848.9 × 10⁻⁶ mm2/s) of periprostatic adipose tissue (a), and axial T2-weighted image and ADC map of a 64-year-old patient with low ADC values (mean: 405.1 × 10⁻⁶ mm2/s) of periprostatic adipose tissue (b).

