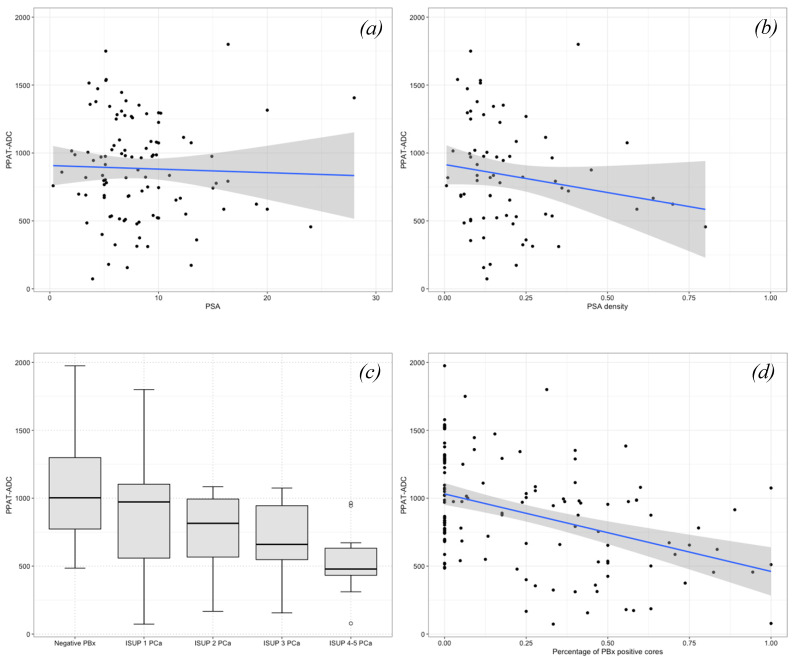
Figure 2.
Scatter plots and box plots illustrating the relationship between periprostatic adipose tissue (PPAT)—apparent diffusion coefficient (ADC) values and (a) PSA, (b) PSA density, (c) ISUP grade group, and (d) percentage of prostate biopsy (PBx) positive cores. PPAT-ADC values decreased for higher PSA, PSA density, ISUP grade group, and percentage of PBx positive cores.

