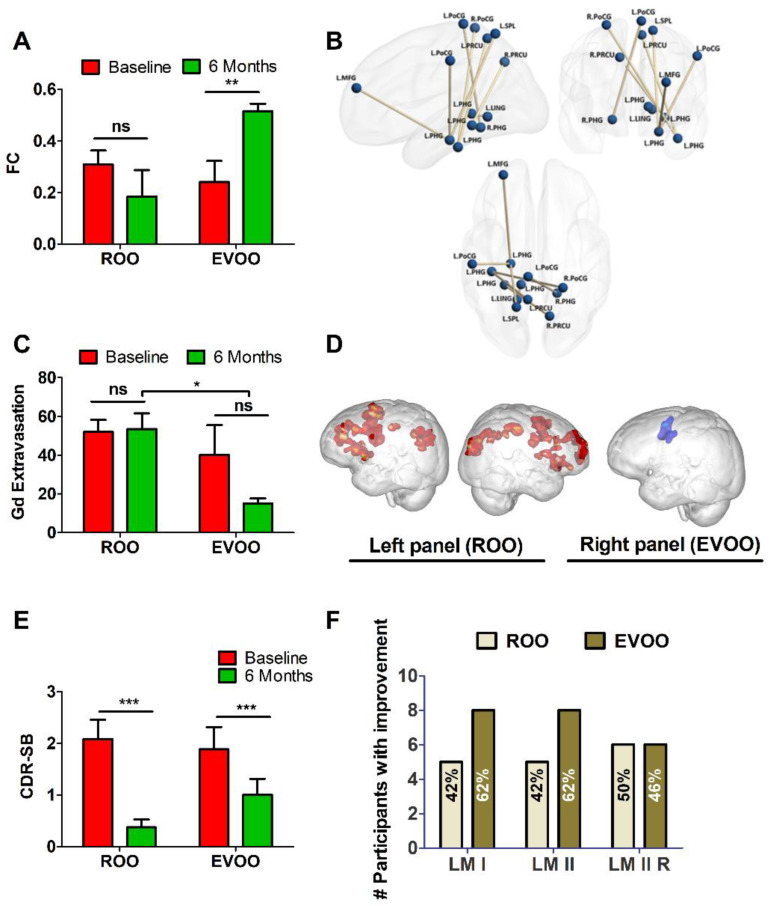
Figure 2.
Findings from MRI screen. Effect of 6-month consumption of ROO and EVOO on (A) Functional connectivity (FC) for overall connections shown in Table 2. The baseline is shown in red and the 6-month timepoint is shown in green, with (B) Visualization of connections shown in Table 2. Abbreviation: Middle Frontal Gyrus (MFG), parahippocampal gyrus (PHG), precuneus (PRCU), Postcentral gyrus (PoCG), lingual gyrus (LING), superior parietal lobule (SPL). L: left and R: right (n = 12 in each group); and (C) BBB permeability assessed as overall Gd extravasation in the hippocampus and PHG shown in Table 2. (D) Comparison of network variant locations between task and rest states. The left panel is for ROO group 6-month > baseline task-rest differences, and the right panel is for EVOO group baseline > 6-month task-rest differences. Please see Tables S1 and S2 for a listing of coordinates from the local maxima within the cluster for ROO and EVOO groups, respectively. Effect of 6-month consumption of ROO and EVOO on (E) CDR-SB, and (F) the number of participants who demonstrated improved learning memory (immediate and delayed) assessed by the WMS-IV logical memory test. Data are presented as mean + SD; ns is not significant, * p < 0.05, ** p < 0.01, *** p < 0.001 is a significant difference between baseline and 6 months post olive oil consumption.

