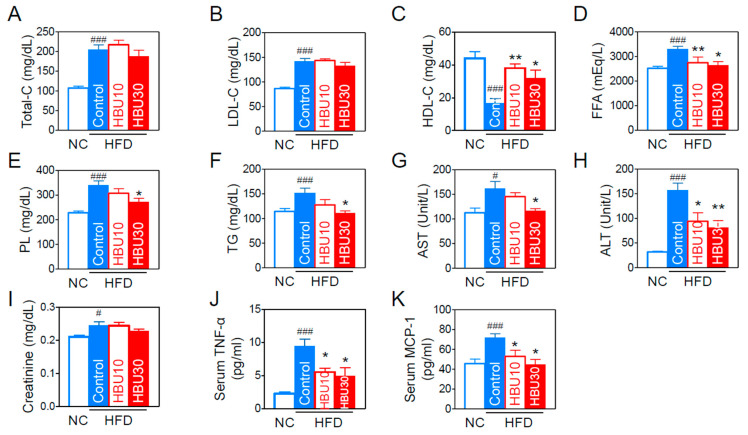
Figure 4.
Effects of HBU651 on the lipid and biochemical profiles in the blood of HFD-induced obese mice. (A) Total-cholesterol (Total-C), (B) LDL-cholesterol (LDL-C), (C) HDL-cholesterol (HDL-C), (D) Free fatty acid (FFA), (E) Phospholipids (PL), (F) Triglyceride (TG), (G,H) Liver function marker enzyme activities of AST (G) and ALT (H), (I) Creatinine, (J,K) ELISA. Serum protein levels of TNF-α (J) and MCP-1 (K). Data are expressed as means ± SEM (n = 5). # p < 0.05, ### p < 0.001 vs. NC, and * p < 0.05, ** p < 0.01 vs. HFD-control. NC, normal chow; Control, HFD-control; HBU10, HFD plus HBU651 10 mg/kg; HBU30, HFD plus HBU651 30 mg/kg.

