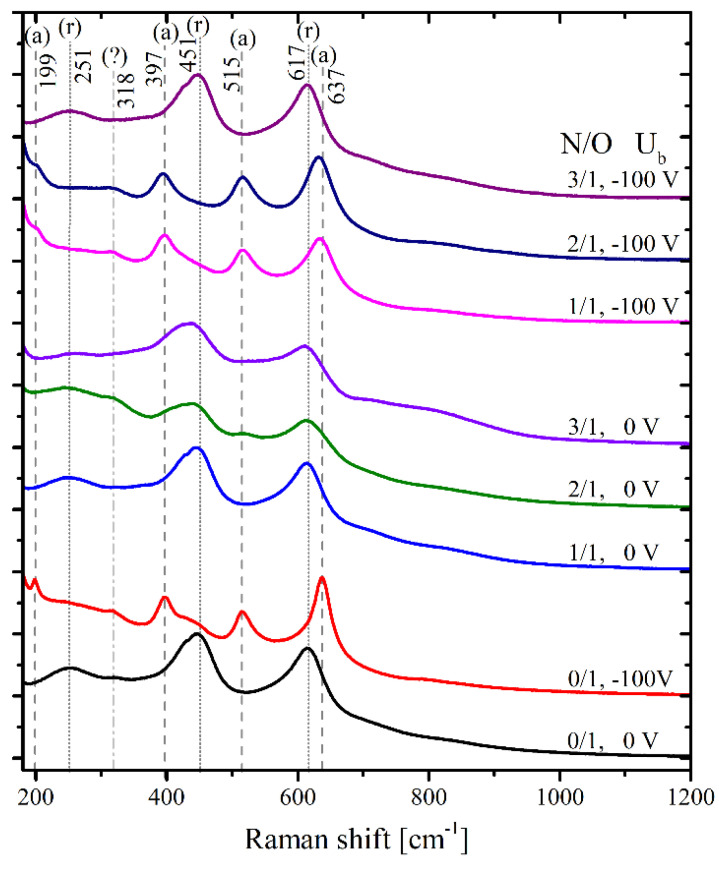
Figure 2.
Raman spectra of the NiTi surfaces. Order of the spectra (from bottom to top): (1) N/O = 0/1, U = 0 V; (2) N/O = 0/1, U = −100 V; (3) N/O = 1/1, U = 0 V; (4) N/O = 2/1, U = 0 V; (5) N/O = 3/1, U = 0 V; (6) N/O = 1/1, U = −100 V; (7) N/O = 2/1, U = −100 V; (8) N/O = 3/1, U = −100 V. The vertical dashed lines indicate the Raman lines of anatase (a); the dotted lines denote the Raman lines of rutile (r). Spectra have been vertically shifted for clarity.

