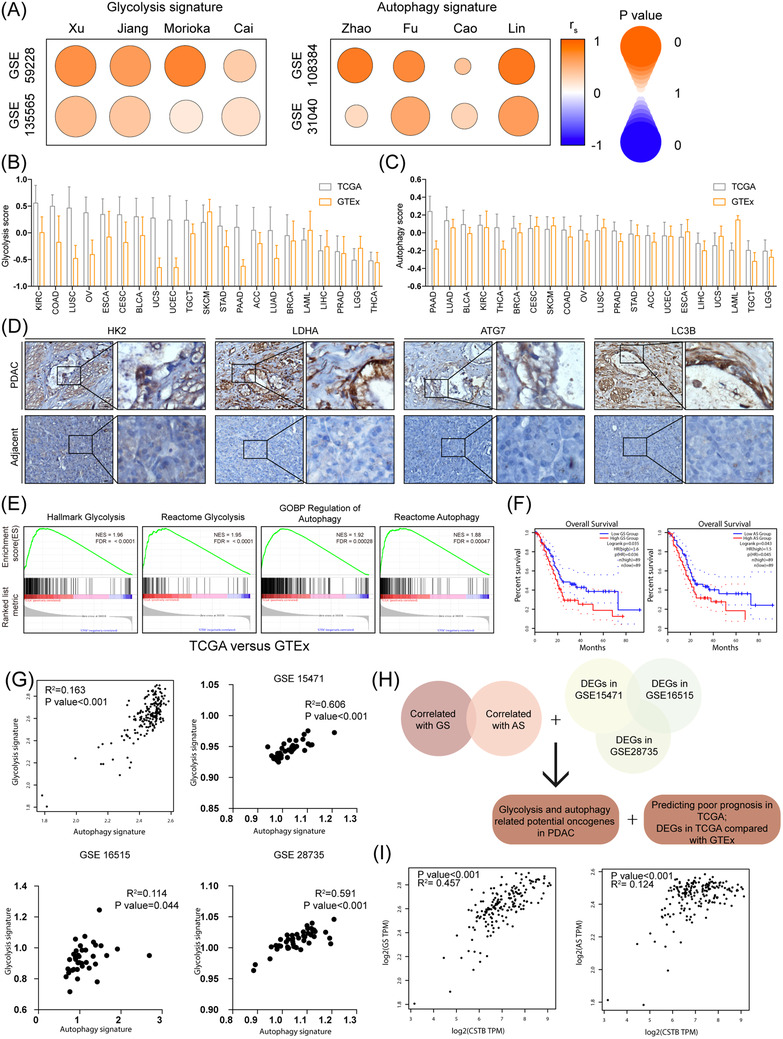
FIGURE 1.

Evaluation of glycolysis and autophagy in pancreatic ductal adenocarcinoma (PDAC). (A) Spearman's correlation of Ruijin signature and the other eight gene signatures in glycolysis and autophagy‐related signatures, respectively. The colour intensity indicates Spearman's rank correlation coefficient (rs); the round size indicates p value for the Spearman's rank correlation. (B) Glycolysis score of TCGA tumour samples and corresponding GTEx normal tissue across cancer types. (C) Autophagy score of TCGA tumour samples and corresponding GTEx normal tissue across cancer types. (D) IHC images of HK2, LDHA, ATG7, and LC3B in PDAC samples and adjacent pancreas. (E) Gene set enrichment analysis plot based on the gene expression profiles between pancreatic cancer in TCGA and normal pancreas in GTEx. (F) Kaplan–Meier curves show that patients with high AS score were accompanied with worse overall survival (OS). (G) Analysis of correlation between glycolysis score and autophagy score in TCGA, GSE 15471, GSE16515, and GSE28735. (H) Diagram showing glycolysis and autophagy‐related gene screening strategy. (I) Correlation between CSTB and GS and AS respectively in TCGA datasets. Scale bar: 25 μm. *p < .05, **p < .01, ***p < .001, and ****p < .0001
