
FIGURE 2.
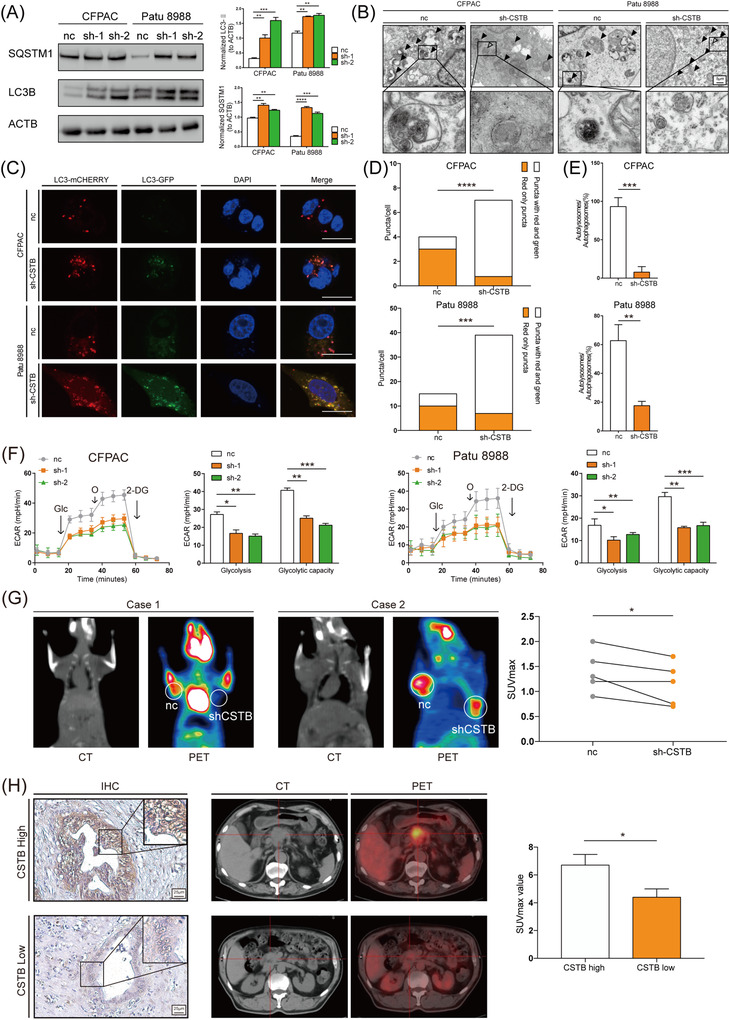
Autophagy flux and glycolysis are promoted by CSTB in pancreatic ductal adenocarcinoma (PDAC). (A) Representative images of SQSTM1, LC3B, and β‐Actin (loading control) immunoblots of control and sh‐CSTB CFPAC and Patu 8988 cells. (B) Transmission electron microscopy shows autolysosome (filled arrow) and autophagosome (hollow arrow) in control and sh‐CSTB‐1 CFPAC and Patu 8988 cells. (C) Representative images of control and sh‐CSTB‐1 CFPAC and Patu 8988 cells expressing mCherry–GFP–LC3B. (D,E) Quantification of LC3B puncta representing autophagosomes (yellow) and autolysosomes (red) in cells. (F) Extracellular acid rate detected by Seahorse analyser in both cell lines. (G) Graph of 18F‐FDG uptake in subcutaneous xenograft model. Control and sh‐CSTB‐1 Patu 8988 cells were used to establish subcutaneous xenograft model. (H) Representative images of CSTB expression in tumour tissues from PDAC patients who received preoperative 18F‐FDG PET/CT examination. The difference in the SUVmax value between CSTB‐high and CSTB‐low groups was analysed. Scale bar: 25 μm. *p < .05, **p < .01, ***p < .001, and ****p < .0001